Immigrants from Jamaica vs Immigrants from Cuba 1 or more Vehicles in Household
COMPARE
Immigrants from Jamaica
Immigrants from Cuba
1 or more Vehicles in Household
1 or more Vehicles in Household Comparison
Immigrants from Jamaica
Immigrants from Cuba
85.8%
1 OR MORE VEHICLES IN HOUSEHOLD
0.0/ 100
METRIC RATING
295th/ 347
METRIC RANK
91.3%
1 OR MORE VEHICLES IN HOUSEHOLD
99.1/ 100
METRIC RATING
94th/ 347
METRIC RANK
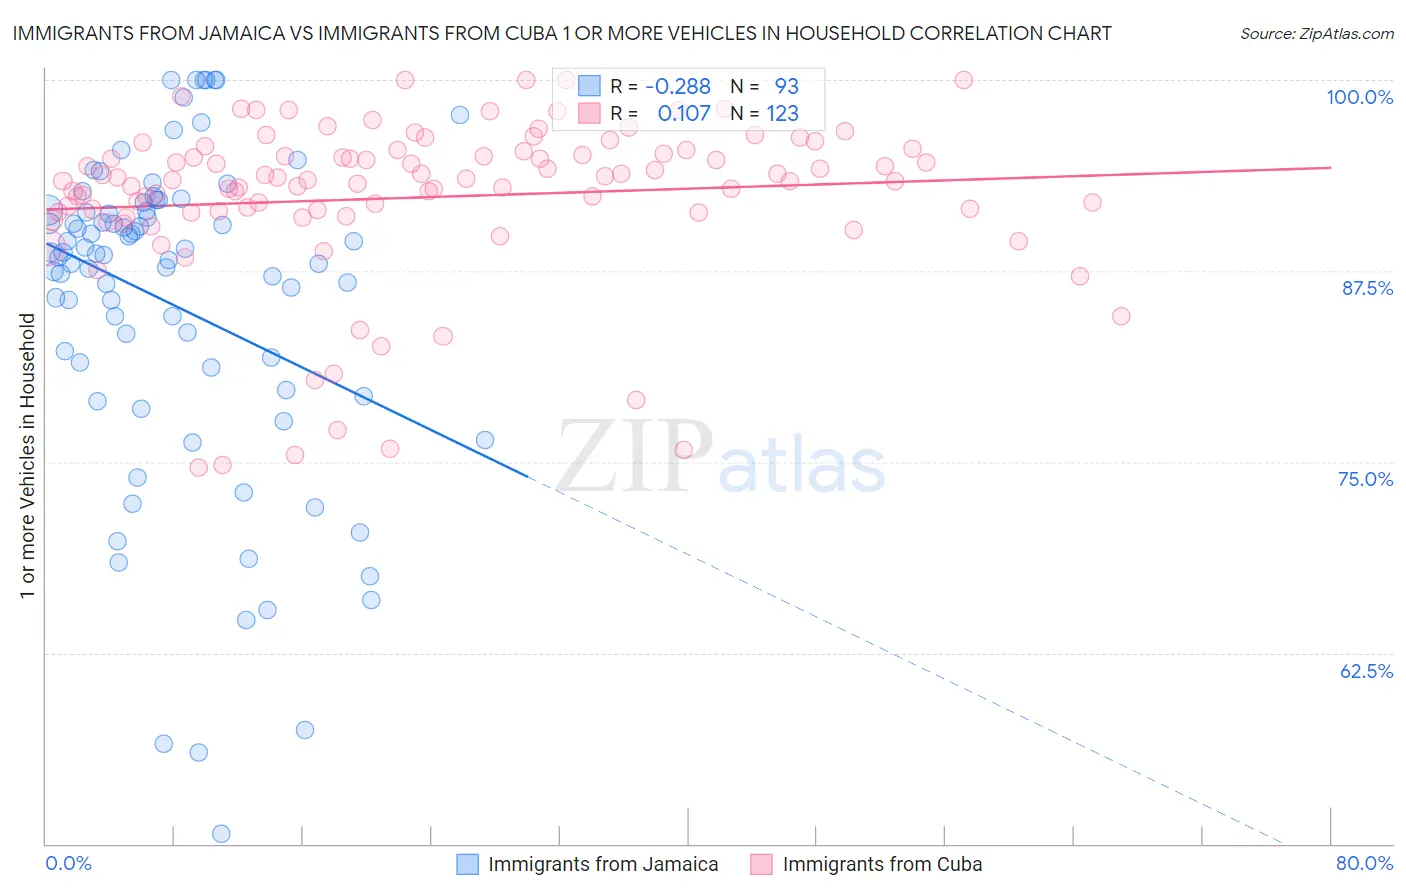
Immigrants from Jamaica vs Immigrants from Cuba 1 or more Vehicles in Household Correlation Chart
The statistical analysis conducted on geographies consisting of 291,409,527 people shows a weak negative correlation between the proportion of Immigrants from Jamaica and percentage of households with 1 or more vehicles available in the United States with a correlation coefficient (R) of -0.288 and weighted average of 85.8%. Similarly, the statistical analysis conducted on geographies consisting of 325,683,329 people shows a poor positive correlation between the proportion of Immigrants from Cuba and percentage of households with 1 or more vehicles available in the United States with a correlation coefficient (R) of 0.107 and weighted average of 91.3%, a difference of 6.4%.
1 or more Vehicles in Household Correlation Summary
| Measurement | Immigrants from Jamaica | Immigrants from Cuba |
| Minimum | 50.6% | 74.7% |
| Maximum | 100.0% | 100.0% |
| Range | 49.4% | 25.3% |
| Mean | 85.3% | 92.3% |
| Median | 88.5% | 93.5% |
| Interquartile 25% (IQ1) | 80.4% | 91.3% |
| Interquartile 75% (IQ3) | 91.4% | 95.4% |
| Interquartile Range (IQR) | 11.0% | 4.1% |
| Standard Deviation (Sample) | 10.7% | 5.4% |
| Standard Deviation (Population) | 10.7% | 5.4% |
Similar Demographics by 1 or more Vehicles in Household
Demographics Similar to Immigrants from Jamaica by 1 or more Vehicles in Household
In terms of 1 or more vehicles in household, the demographic groups most similar to Immigrants from Jamaica are Immigrants from Spain (85.8%, a difference of 0.030%), Paraguayan (85.7%, a difference of 0.12%), Alaskan Athabascan (86.0%, a difference of 0.17%), Belizean (85.7%, a difference of 0.20%), and Indian (Asian) (86.0%, a difference of 0.24%).
| Demographics | Rating | Rank | 1 or more Vehicles in Household |
| Hopi | 0.0 /100 | #288 | Tragic 86.4% |
| Immigrants | Ireland | 0.0 /100 | #289 | Tragic 86.4% |
| Immigrants | Australia | 0.0 /100 | #290 | Tragic 86.4% |
| Pima | 0.0 /100 | #291 | Tragic 86.3% |
| Okinawans | 0.0 /100 | #292 | Tragic 86.1% |
| Indians (Asian) | 0.0 /100 | #293 | Tragic 86.0% |
| Alaskan Athabascans | 0.0 /100 | #294 | Tragic 86.0% |
| Immigrants | Jamaica | 0.0 /100 | #295 | Tragic 85.8% |
| Immigrants | Spain | 0.0 /100 | #296 | Tragic 85.8% |
| Paraguayans | 0.0 /100 | #297 | Tragic 85.7% |
| Belizeans | 0.0 /100 | #298 | Tragic 85.7% |
| Yuman | 0.0 /100 | #299 | Tragic 85.5% |
| Immigrants | Russia | 0.0 /100 | #300 | Tragic 85.4% |
| Immigrants | Panama | 0.0 /100 | #301 | Tragic 85.4% |
| Moroccans | 0.0 /100 | #302 | Tragic 85.4% |
Demographics Similar to Immigrants from Cuba by 1 or more Vehicles in Household
In terms of 1 or more vehicles in household, the demographic groups most similar to Immigrants from Cuba are Austrian (91.3%, a difference of 0.010%), Potawatomi (91.3%, a difference of 0.020%), Pakistani (91.3%, a difference of 0.030%), Bhutanese (91.4%, a difference of 0.060%), and Immigrants from North America (91.4%, a difference of 0.060%).
| Demographics | Rating | Rank | 1 or more Vehicles in Household |
| Immigrants | Germany | 99.2 /100 | #87 | Exceptional 91.4% |
| Spanish Americans | 99.2 /100 | #88 | Exceptional 91.4% |
| Bangladeshis | 99.2 /100 | #89 | Exceptional 91.4% |
| Immigrants | Canada | 99.2 /100 | #90 | Exceptional 91.4% |
| Immigrants | Jordan | 99.2 /100 | #91 | Exceptional 91.4% |
| Bhutanese | 99.2 /100 | #92 | Exceptional 91.4% |
| Immigrants | North America | 99.2 /100 | #93 | Exceptional 91.4% |
| Immigrants | Cuba | 99.1 /100 | #94 | Exceptional 91.3% |
| Austrians | 99.0 /100 | #95 | Exceptional 91.3% |
| Potawatomi | 99.0 /100 | #96 | Exceptional 91.3% |
| Pakistanis | 99.0 /100 | #97 | Exceptional 91.3% |
| Slavs | 98.7 /100 | #98 | Exceptional 91.2% |
| Immigrants | Bolivia | 98.6 /100 | #99 | Exceptional 91.2% |
| Immigrants | Central America | 98.4 /100 | #100 | Exceptional 91.1% |
| Bulgarians | 98.4 /100 | #101 | Exceptional 91.1% |