Somali vs Immigrants from Greece 1 or more Vehicles in Household
COMPARE
Somali
Immigrants from Greece
1 or more Vehicles in Household
1 or more Vehicles in Household Comparison
Somalis
Immigrants from Greece
89.0%
1 OR MORE VEHICLES IN HOUSEHOLD
12.8/ 100
METRIC RATING
212th/ 347
METRIC RANK
85.4%
1 OR MORE VEHICLES IN HOUSEHOLD
0.0/ 100
METRIC RATING
303rd/ 347
METRIC RANK
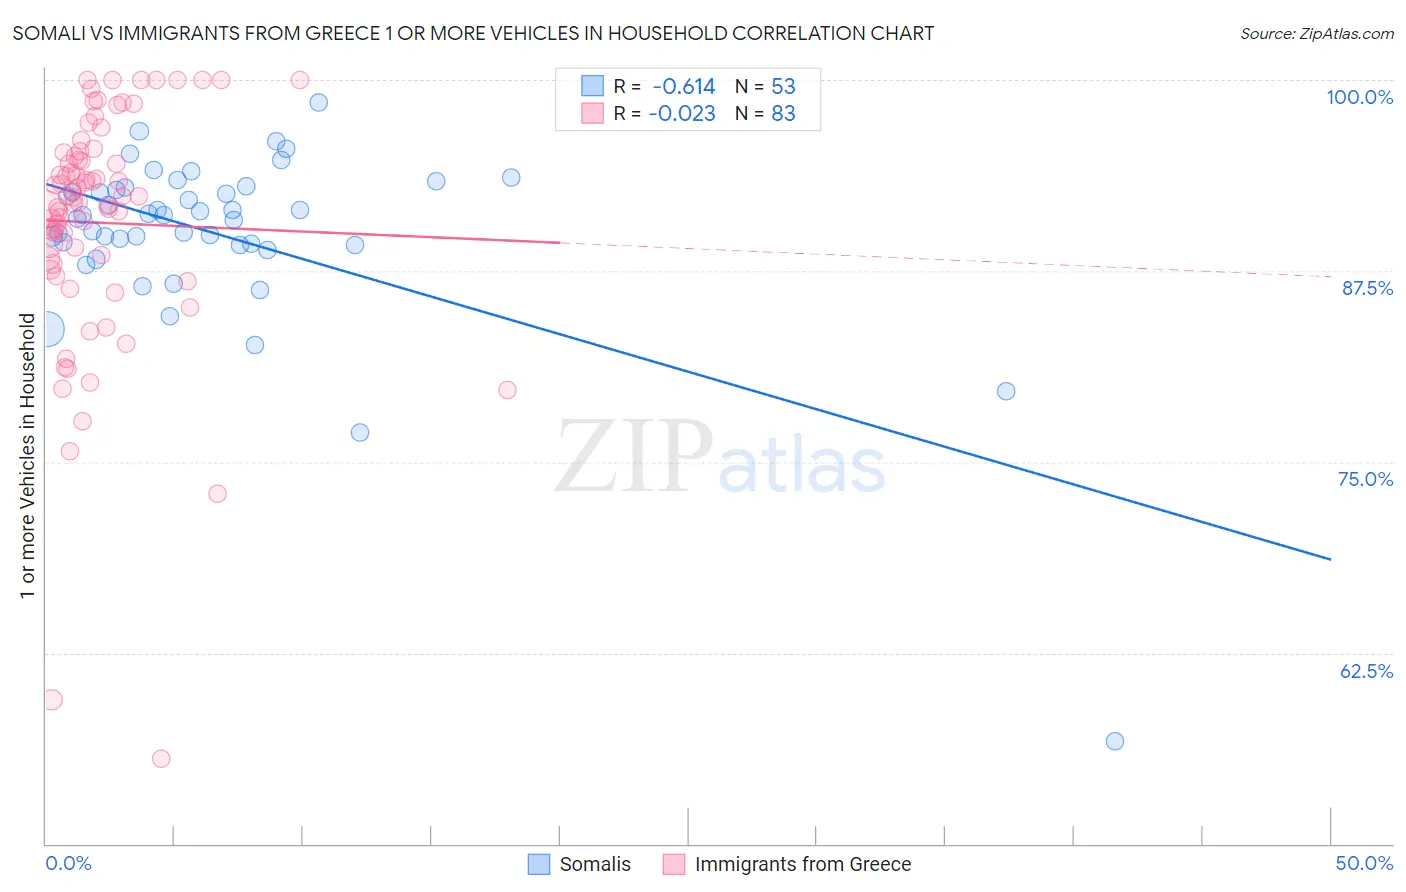
Somali vs Immigrants from Greece 1 or more Vehicles in Household Correlation Chart
The statistical analysis conducted on geographies consisting of 99,266,005 people shows a significant negative correlation between the proportion of Somalis and percentage of households with 1 or more vehicles available in the United States with a correlation coefficient (R) of -0.614 and weighted average of 89.0%. Similarly, the statistical analysis conducted on geographies consisting of 216,749,502 people shows no correlation between the proportion of Immigrants from Greece and percentage of households with 1 or more vehicles available in the United States with a correlation coefficient (R) of -0.023 and weighted average of 85.4%, a difference of 4.3%.
1 or more Vehicles in Household Correlation Summary
| Measurement | Somali | Immigrants from Greece |
| Minimum | 56.7% | 55.5% |
| Maximum | 98.6% | 100.0% |
| Range | 41.9% | 44.5% |
| Mean | 89.9% | 90.7% |
| Median | 91.2% | 92.3% |
| Interquartile 25% (IQ1) | 89.2% | 88.0% |
| Interquartile 75% (IQ3) | 92.9% | 95.3% |
| Interquartile Range (IQR) | 3.7% | 7.3% |
| Standard Deviation (Sample) | 6.1% | 8.1% |
| Standard Deviation (Population) | 6.0% | 8.0% |
Similar Demographics by 1 or more Vehicles in Household
Demographics Similar to Somalis by 1 or more Vehicles in Household
In terms of 1 or more vehicles in household, the demographic groups most similar to Somalis are Sierra Leonean (89.0%, a difference of 0.010%), Immigrants from Western Asia (89.0%, a difference of 0.020%), Dutch West Indian (89.0%, a difference of 0.030%), Immigrants from Hungary (89.0%, a difference of 0.030%), and Immigrants from Italy (89.1%, a difference of 0.040%).
| Demographics | Rating | Rank | 1 or more Vehicles in Household |
| Guatemalans | 17.8 /100 | #205 | Poor 89.2% |
| Apache | 16.2 /100 | #206 | Poor 89.1% |
| Immigrants | Denmark | 14.8 /100 | #207 | Poor 89.1% |
| Immigrants | Chile | 14.4 /100 | #208 | Poor 89.1% |
| Immigrants | Italy | 14.0 /100 | #209 | Poor 89.1% |
| Dutch West Indians | 13.5 /100 | #210 | Poor 89.0% |
| Sierra Leoneans | 13.0 /100 | #211 | Poor 89.0% |
| Somalis | 12.8 /100 | #212 | Poor 89.0% |
| Immigrants | Western Asia | 12.3 /100 | #213 | Poor 89.0% |
| Immigrants | Hungary | 11.9 /100 | #214 | Poor 89.0% |
| Immigrants | Sri Lanka | 10.2 /100 | #215 | Poor 88.9% |
| Immigrants | Argentina | 9.4 /100 | #216 | Tragic 88.9% |
| Argentineans | 8.8 /100 | #217 | Tragic 88.9% |
| Ugandans | 8.7 /100 | #218 | Tragic 88.9% |
| Immigrants | Guatemala | 8.6 /100 | #219 | Tragic 88.9% |
Demographics Similar to Immigrants from Greece by 1 or more Vehicles in Household
In terms of 1 or more vehicles in household, the demographic groups most similar to Immigrants from Greece are Moroccan (85.4%, a difference of 0.030%), Immigrants from Panama (85.4%, a difference of 0.050%), Immigrants from Russia (85.4%, a difference of 0.090%), Yuman (85.5%, a difference of 0.10%), and Immigrants from Ukraine (85.2%, a difference of 0.17%).
| Demographics | Rating | Rank | 1 or more Vehicles in Household |
| Immigrants | Spain | 0.0 /100 | #296 | Tragic 85.8% |
| Paraguayans | 0.0 /100 | #297 | Tragic 85.7% |
| Belizeans | 0.0 /100 | #298 | Tragic 85.7% |
| Yuman | 0.0 /100 | #299 | Tragic 85.5% |
| Immigrants | Russia | 0.0 /100 | #300 | Tragic 85.4% |
| Immigrants | Panama | 0.0 /100 | #301 | Tragic 85.4% |
| Moroccans | 0.0 /100 | #302 | Tragic 85.4% |
| Immigrants | Greece | 0.0 /100 | #303 | Tragic 85.4% |
| Immigrants | Ukraine | 0.0 /100 | #304 | Tragic 85.2% |
| Immigrants | China | 0.0 /100 | #305 | Tragic 84.9% |
| Immigrants | Western Africa | 0.0 /100 | #306 | Tragic 84.9% |
| Tohono O'odham | 0.0 /100 | #307 | Tragic 84.7% |
| Immigrants | Belize | 0.0 /100 | #308 | Tragic 84.7% |
| Immigrants | Haiti | 0.0 /100 | #309 | Tragic 84.7% |
| U.S. Virgin Islanders | 0.0 /100 | #310 | Tragic 84.6% |