Immigrants from the Azores vs Immigrants from Cuba 1 or more Vehicles in Household
COMPARE
Immigrants from the Azores
Immigrants from Cuba
1 or more Vehicles in Household
1 or more Vehicles in Household Comparison
Immigrants from the Azores
Immigrants from Cuba
90.4%
1 OR MORE VEHICLES IN HOUSEHOLD
89.1/ 100
METRIC RATING
127th/ 347
METRIC RANK
91.3%
1 OR MORE VEHICLES IN HOUSEHOLD
99.1/ 100
METRIC RATING
94th/ 347
METRIC RANK
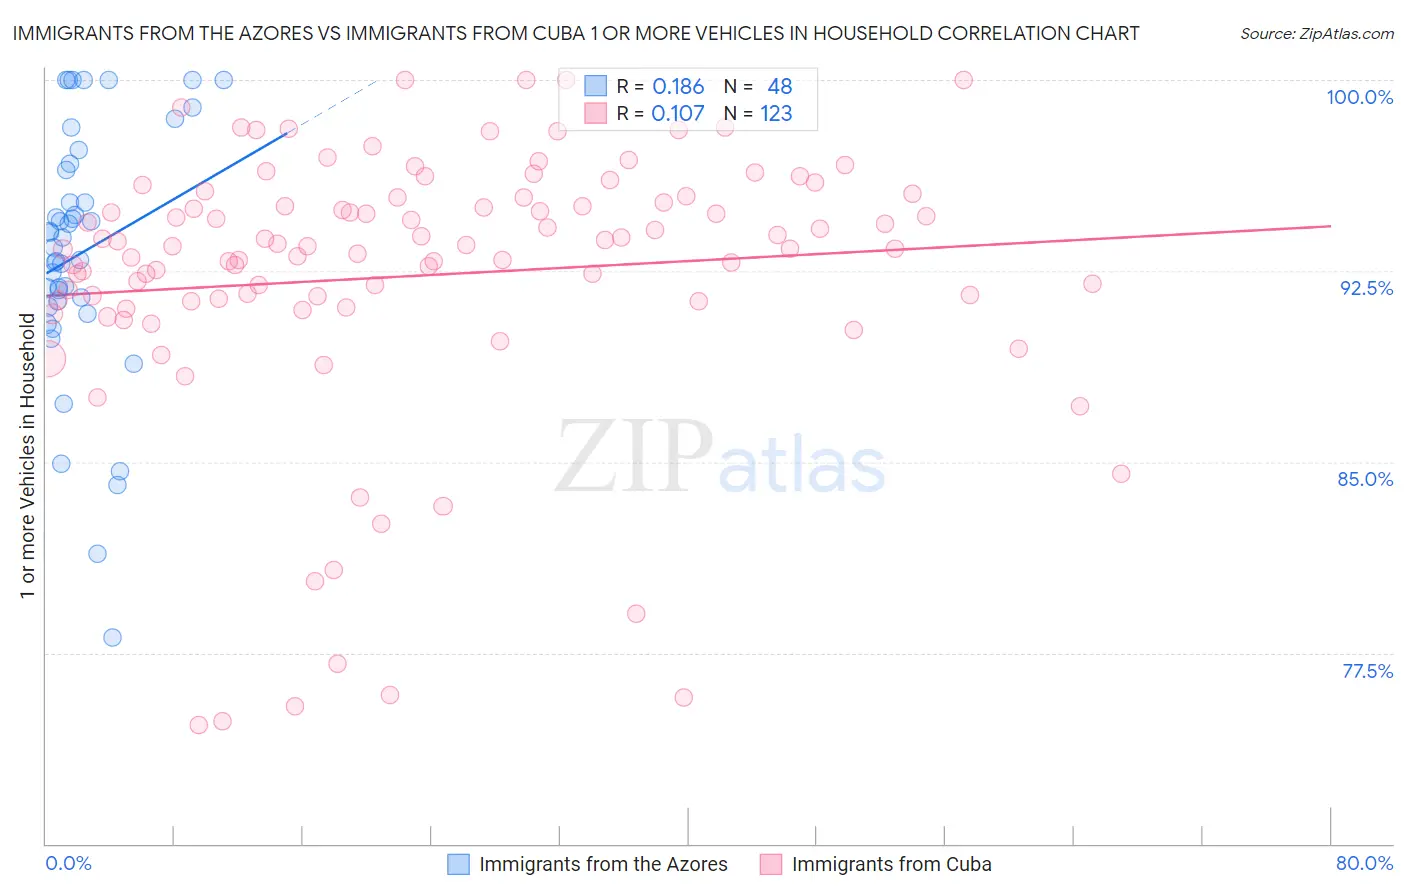
Immigrants from the Azores vs Immigrants from Cuba 1 or more Vehicles in Household Correlation Chart
The statistical analysis conducted on geographies consisting of 46,255,729 people shows a poor positive correlation between the proportion of Immigrants from the Azores and percentage of households with 1 or more vehicles available in the United States with a correlation coefficient (R) of 0.186 and weighted average of 90.4%. Similarly, the statistical analysis conducted on geographies consisting of 325,683,329 people shows a poor positive correlation between the proportion of Immigrants from Cuba and percentage of households with 1 or more vehicles available in the United States with a correlation coefficient (R) of 0.107 and weighted average of 91.3%, a difference of 0.99%.
1 or more Vehicles in Household Correlation Summary
| Measurement | Immigrants from the Azores | Immigrants from Cuba |
| Minimum | 78.1% | 74.7% |
| Maximum | 100.0% | 100.0% |
| Range | 21.9% | 25.3% |
| Mean | 93.2% | 92.3% |
| Median | 93.6% | 93.5% |
| Interquartile 25% (IQ1) | 91.2% | 91.3% |
| Interquartile 75% (IQ3) | 96.6% | 95.4% |
| Interquartile Range (IQR) | 5.4% | 4.1% |
| Standard Deviation (Sample) | 5.0% | 5.4% |
| Standard Deviation (Population) | 4.9% | 5.4% |
Similar Demographics by 1 or more Vehicles in Household
Demographics Similar to Immigrants from the Azores by 1 or more Vehicles in Household
In terms of 1 or more vehicles in household, the demographic groups most similar to Immigrants from the Azores are Burmese (90.4%, a difference of 0.0%), Immigrants from Cameroon (90.4%, a difference of 0.010%), Marshallese (90.4%, a difference of 0.010%), Nicaraguan (90.4%, a difference of 0.010%), and Immigrants from Kenya (90.4%, a difference of 0.020%).
| Demographics | Rating | Rank | 1 or more Vehicles in Household |
| Immigrants | Thailand | 92.3 /100 | #120 | Exceptional 90.6% |
| Icelanders | 92.1 /100 | #121 | Exceptional 90.5% |
| Costa Ricans | 92.0 /100 | #122 | Exceptional 90.5% |
| Fijians | 91.8 /100 | #123 | Exceptional 90.5% |
| Puget Sound Salish | 91.5 /100 | #124 | Exceptional 90.5% |
| Immigrants | Korea | 90.5 /100 | #125 | Exceptional 90.5% |
| Immigrants | Cameroon | 89.4 /100 | #126 | Excellent 90.4% |
| Immigrants | Azores | 89.1 /100 | #127 | Excellent 90.4% |
| Burmese | 89.0 /100 | #128 | Excellent 90.4% |
| Marshallese | 88.9 /100 | #129 | Excellent 90.4% |
| Nicaraguans | 88.8 /100 | #130 | Excellent 90.4% |
| Immigrants | Kenya | 88.5 /100 | #131 | Excellent 90.4% |
| Immigrants | South Africa | 88.1 /100 | #132 | Excellent 90.4% |
| Immigrants | Syria | 87.5 /100 | #133 | Excellent 90.4% |
| Kenyans | 87.0 /100 | #134 | Excellent 90.4% |
Demographics Similar to Immigrants from Cuba by 1 or more Vehicles in Household
In terms of 1 or more vehicles in household, the demographic groups most similar to Immigrants from Cuba are Austrian (91.3%, a difference of 0.010%), Potawatomi (91.3%, a difference of 0.020%), Pakistani (91.3%, a difference of 0.030%), Bhutanese (91.4%, a difference of 0.060%), and Immigrants from North America (91.4%, a difference of 0.060%).
| Demographics | Rating | Rank | 1 or more Vehicles in Household |
| Immigrants | Germany | 99.2 /100 | #87 | Exceptional 91.4% |
| Spanish Americans | 99.2 /100 | #88 | Exceptional 91.4% |
| Bangladeshis | 99.2 /100 | #89 | Exceptional 91.4% |
| Immigrants | Canada | 99.2 /100 | #90 | Exceptional 91.4% |
| Immigrants | Jordan | 99.2 /100 | #91 | Exceptional 91.4% |
| Bhutanese | 99.2 /100 | #92 | Exceptional 91.4% |
| Immigrants | North America | 99.2 /100 | #93 | Exceptional 91.4% |
| Immigrants | Cuba | 99.1 /100 | #94 | Exceptional 91.3% |
| Austrians | 99.0 /100 | #95 | Exceptional 91.3% |
| Potawatomi | 99.0 /100 | #96 | Exceptional 91.3% |
| Pakistanis | 99.0 /100 | #97 | Exceptional 91.3% |
| Slavs | 98.7 /100 | #98 | Exceptional 91.2% |
| Immigrants | Bolivia | 98.6 /100 | #99 | Exceptional 91.2% |
| Immigrants | Central America | 98.4 /100 | #100 | Exceptional 91.1% |
| Bulgarians | 98.4 /100 | #101 | Exceptional 91.1% |