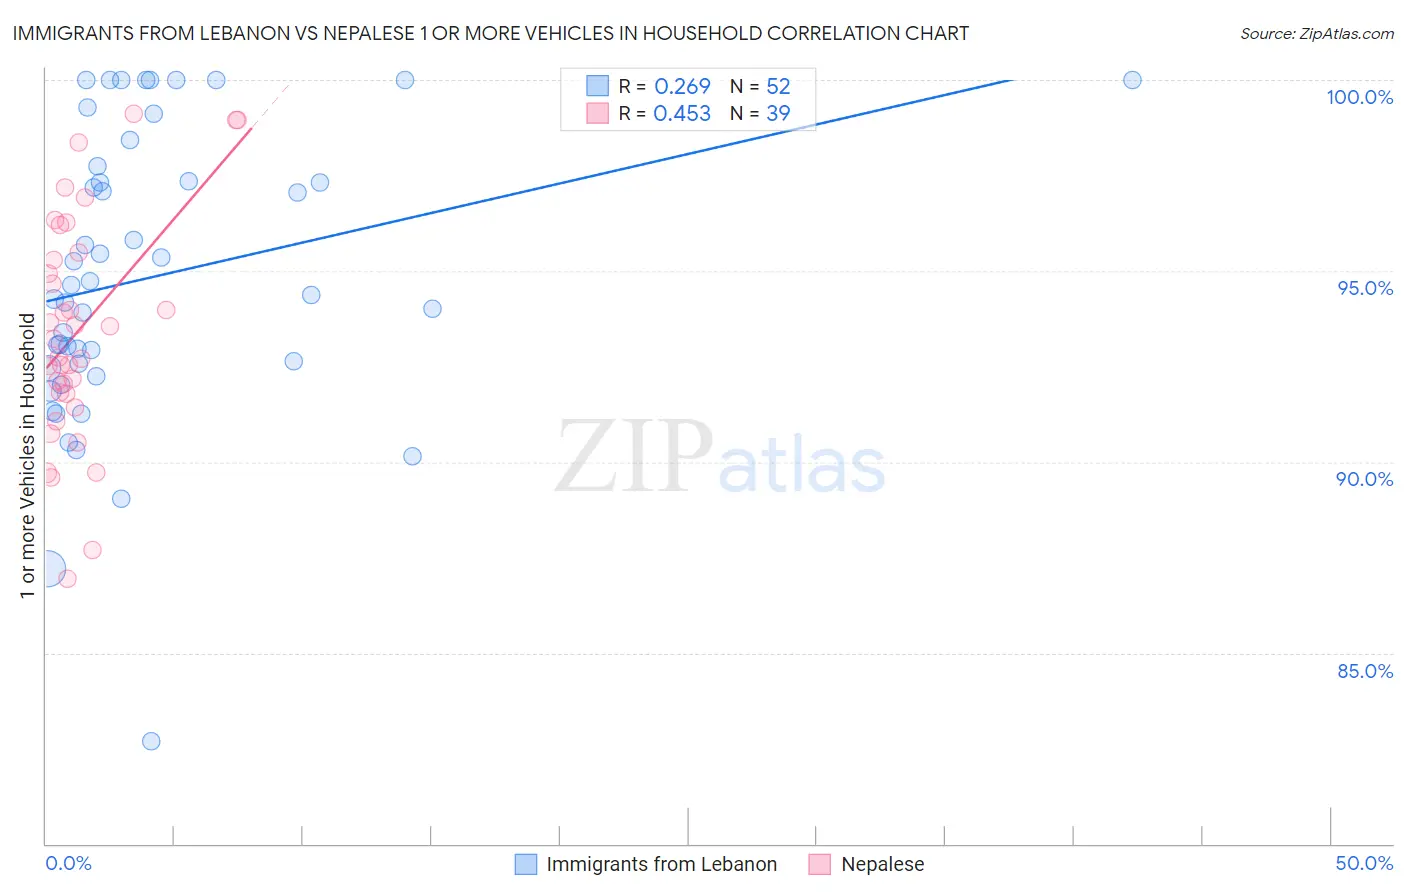
Immigrants from Lebanon vs Nepalese 1 or more Vehicles in Household
COMPARE
Immigrants from Lebanon
Nepalese
1 or more Vehicles in Household
1 or more Vehicles in Household Comparison
Immigrants from Lebanon
Nepalese
91.6%
1 OR MORE VEHICLES IN HOUSEHOLD
99.6/ 100
METRIC RATING
74th/ 347
METRIC RANK
92.6%
1 OR MORE VEHICLES IN HOUSEHOLD
100.0/ 100
METRIC RATING
23rd/ 347
METRIC RANK
Immigrants from Lebanon vs Nepalese 1 or more Vehicles in Household Correlation Chart
The statistical analysis conducted on geographies consisting of 216,991,778 people shows a weak positive correlation between the proportion of Immigrants from Lebanon and percentage of households with 1 or more vehicles available in the United States with a correlation coefficient (R) of 0.269 and weighted average of 91.6%. Similarly, the statistical analysis conducted on geographies consisting of 24,483,296 people shows a moderate positive correlation between the proportion of Nepalese and percentage of households with 1 or more vehicles available in the United States with a correlation coefficient (R) of 0.453 and weighted average of 92.6%, a difference of 1.1%.
1 or more Vehicles in Household Correlation Summary
| Measurement | Immigrants from Lebanon | Nepalese |
| Minimum | 82.7% | 86.9% |
| Maximum | 100.0% | 99.1% |
| Range | 17.3% | 12.2% |
| Mean | 94.8% | 93.5% |
| Median | 94.5% | 93.2% |
| Interquartile 25% (IQ1) | 92.5% | 91.8% |
| Interquartile 75% (IQ3) | 97.5% | 95.5% |
| Interquartile Range (IQR) | 5.0% | 3.7% |
| Standard Deviation (Sample) | 3.8% | 3.0% |
| Standard Deviation (Population) | 3.8% | 2.9% |
Similar Demographics by 1 or more Vehicles in Household
Demographics Similar to Immigrants from Lebanon by 1 or more Vehicles in Household
In terms of 1 or more vehicles in household, the demographic groups most similar to Immigrants from Lebanon are Immigrants from Iran (91.7%, a difference of 0.030%), Polish (91.7%, a difference of 0.050%), Cajun (91.7%, a difference of 0.050%), Lithuanian (91.7%, a difference of 0.070%), and Palestinian (91.7%, a difference of 0.080%).
| Demographics | Rating | Rank | 1 or more Vehicles in Household |
| Spaniards | 99.8 /100 | #67 | Exceptional 91.8% |
| Immigrants | Scotland | 99.7 /100 | #68 | Exceptional 91.8% |
| Palestinians | 99.7 /100 | #69 | Exceptional 91.7% |
| Lithuanians | 99.7 /100 | #70 | Exceptional 91.7% |
| Poles | 99.7 /100 | #71 | Exceptional 91.7% |
| Cajuns | 99.7 /100 | #72 | Exceptional 91.7% |
| Immigrants | Iran | 99.7 /100 | #73 | Exceptional 91.7% |
| Immigrants | Lebanon | 99.6 /100 | #74 | Exceptional 91.6% |
| Portuguese | 99.5 /100 | #75 | Exceptional 91.6% |
| Cubans | 99.5 /100 | #76 | Exceptional 91.5% |
| Immigrants | Philippines | 99.4 /100 | #77 | Exceptional 91.5% |
| Iranians | 99.4 /100 | #78 | Exceptional 91.5% |
| Immigrants | South Central Asia | 99.4 /100 | #79 | Exceptional 91.5% |
| Bolivians | 99.4 /100 | #80 | Exceptional 91.5% |
| Immigrants | South Eastern Asia | 99.3 /100 | #81 | Exceptional 91.4% |
Demographics Similar to Nepalese by 1 or more Vehicles in Household
In terms of 1 or more vehicles in household, the demographic groups most similar to Nepalese are French (92.7%, a difference of 0.070%), Yaqui (92.6%, a difference of 0.070%), Ottawa (92.7%, a difference of 0.080%), Immigrants from Iraq (92.5%, a difference of 0.090%), and Arapaho (92.7%, a difference of 0.10%).
| Demographics | Rating | Rank | 1 or more Vehicles in Household |
| Assyrians/Chaldeans/Syriacs | 100.0 /100 | #16 | Exceptional 93.0% |
| Europeans | 100.0 /100 | #17 | Exceptional 93.0% |
| Welsh | 100.0 /100 | #18 | Exceptional 93.0% |
| Tongans | 100.0 /100 | #19 | Exceptional 92.9% |
| Arapaho | 100.0 /100 | #20 | Exceptional 92.7% |
| Ottawa | 100.0 /100 | #21 | Exceptional 92.7% |
| French | 100.0 /100 | #22 | Exceptional 92.7% |
| Nepalese | 100.0 /100 | #23 | Exceptional 92.6% |
| Yaqui | 100.0 /100 | #24 | Exceptional 92.6% |
| Immigrants | Iraq | 100.0 /100 | #25 | Exceptional 92.5% |
| British | 100.0 /100 | #26 | Exceptional 92.5% |
| Americans | 100.0 /100 | #27 | Exceptional 92.5% |
| Sri Lankans | 100.0 /100 | #28 | Exceptional 92.5% |
| Native Hawaiians | 100.0 /100 | #29 | Exceptional 92.4% |
| Finns | 100.0 /100 | #30 | Exceptional 92.4% |