Immigrants from Haiti vs Swiss 1 or more Vehicles in Household
COMPARE
Immigrants from Haiti
Swiss
1 or more Vehicles in Household
1 or more Vehicles in Household Comparison
Immigrants from Haiti
Swiss
84.7%
1 OR MORE VEHICLES IN HOUSEHOLD
0.0/ 100
METRIC RATING
309th/ 347
METRIC RANK
92.3%
1 OR MORE VEHICLES IN HOUSEHOLD
99.9/ 100
METRIC RATING
39th/ 347
METRIC RANK
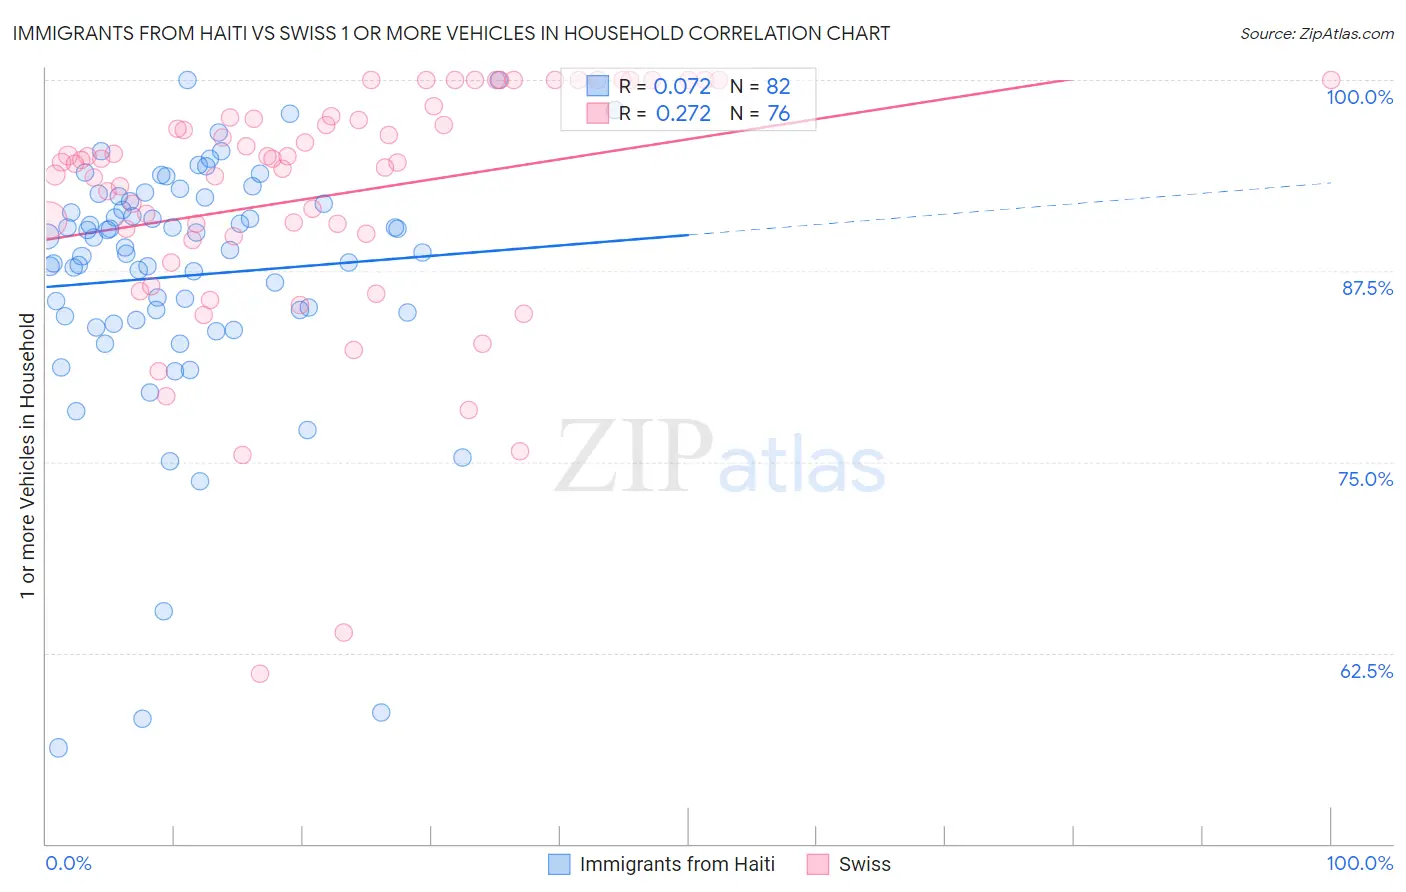
Immigrants from Haiti vs Swiss 1 or more Vehicles in Household Correlation Chart
The statistical analysis conducted on geographies consisting of 225,185,798 people shows a slight positive correlation between the proportion of Immigrants from Haiti and percentage of households with 1 or more vehicles available in the United States with a correlation coefficient (R) of 0.072 and weighted average of 84.7%. Similarly, the statistical analysis conducted on geographies consisting of 464,812,678 people shows a weak positive correlation between the proportion of Swiss and percentage of households with 1 or more vehicles available in the United States with a correlation coefficient (R) of 0.272 and weighted average of 92.3%, a difference of 9.0%.
1 or more Vehicles in Household Correlation Summary
| Measurement | Immigrants from Haiti | Swiss |
| Minimum | 56.3% | 61.1% |
| Maximum | 100.0% | 100.0% |
| Range | 43.7% | 38.9% |
| Mean | 87.2% | 92.4% |
| Median | 88.9% | 94.7% |
| Interquartile 25% (IQ1) | 84.5% | 89.9% |
| Interquartile 75% (IQ3) | 92.1% | 97.6% |
| Interquartile Range (IQR) | 7.5% | 7.7% |
| Standard Deviation (Sample) | 8.3% | 8.0% |
| Standard Deviation (Population) | 8.3% | 7.9% |
Similar Demographics by 1 or more Vehicles in Household
Demographics Similar to Immigrants from Haiti by 1 or more Vehicles in Household
In terms of 1 or more vehicles in household, the demographic groups most similar to Immigrants from Haiti are Immigrants from Belize (84.7%, a difference of 0.010%), U.S. Virgin Islander (84.6%, a difference of 0.030%), Tohono O'odham (84.7%, a difference of 0.040%), Puerto Rican (84.6%, a difference of 0.070%), and Cape Verdean (84.5%, a difference of 0.18%).
| Demographics | Rating | Rank | 1 or more Vehicles in Household |
| Moroccans | 0.0 /100 | #302 | Tragic 85.4% |
| Immigrants | Greece | 0.0 /100 | #303 | Tragic 85.4% |
| Immigrants | Ukraine | 0.0 /100 | #304 | Tragic 85.2% |
| Immigrants | China | 0.0 /100 | #305 | Tragic 84.9% |
| Immigrants | Western Africa | 0.0 /100 | #306 | Tragic 84.9% |
| Tohono O'odham | 0.0 /100 | #307 | Tragic 84.7% |
| Immigrants | Belize | 0.0 /100 | #308 | Tragic 84.7% |
| Immigrants | Haiti | 0.0 /100 | #309 | Tragic 84.7% |
| U.S. Virgin Islanders | 0.0 /100 | #310 | Tragic 84.6% |
| Puerto Ricans | 0.0 /100 | #311 | Tragic 84.6% |
| Cape Verdeans | 0.0 /100 | #312 | Tragic 84.5% |
| Immigrants | Israel | 0.0 /100 | #313 | Tragic 84.5% |
| Albanians | 0.0 /100 | #314 | Tragic 84.4% |
| Cypriots | 0.0 /100 | #315 | Tragic 84.4% |
| Alaska Natives | 0.0 /100 | #316 | Tragic 83.8% |
Demographics Similar to Swiss by 1 or more Vehicles in Household
In terms of 1 or more vehicles in household, the demographic groups most similar to Swiss are Creek (92.3%, a difference of 0.0%), French Canadian (92.3%, a difference of 0.010%), Immigrants from Vietnam (92.3%, a difference of 0.010%), Czechoslovakian (92.3%, a difference of 0.020%), and Malaysian (92.3%, a difference of 0.020%).
| Demographics | Rating | Rank | 1 or more Vehicles in Household |
| Basques | 100.0 /100 | #32 | Exceptional 92.4% |
| Cherokee | 100.0 /100 | #33 | Exceptional 92.4% |
| Italians | 99.9 /100 | #34 | Exceptional 92.3% |
| Czechoslovakians | 99.9 /100 | #35 | Exceptional 92.3% |
| Malaysians | 99.9 /100 | #36 | Exceptional 92.3% |
| French Canadians | 99.9 /100 | #37 | Exceptional 92.3% |
| Immigrants | Vietnam | 99.9 /100 | #38 | Exceptional 92.3% |
| Swiss | 99.9 /100 | #39 | Exceptional 92.3% |
| Creek | 99.9 /100 | #40 | Exceptional 92.3% |
| Immigrants | Taiwan | 99.9 /100 | #41 | Exceptional 92.3% |
| Chickasaw | 99.9 /100 | #42 | Exceptional 92.3% |
| Spanish | 99.9 /100 | #43 | Exceptional 92.3% |
| Choctaw | 99.9 /100 | #44 | Exceptional 92.2% |
| Immigrants | Nonimmigrants | 99.9 /100 | #45 | Exceptional 92.2% |
| Immigrants | Fiji | 99.9 /100 | #46 | Exceptional 92.2% |