Immigrants from Senegal vs Swiss 1 or more Vehicles in Household
COMPARE
Immigrants from Senegal
Swiss
1 or more Vehicles in Household
1 or more Vehicles in Household Comparison
Immigrants from Senegal
Swiss
79.0%
1 OR MORE VEHICLES IN HOUSEHOLD
0.0/ 100
METRIC RATING
327th/ 347
METRIC RANK
92.3%
1 OR MORE VEHICLES IN HOUSEHOLD
99.9/ 100
METRIC RATING
39th/ 347
METRIC RANK
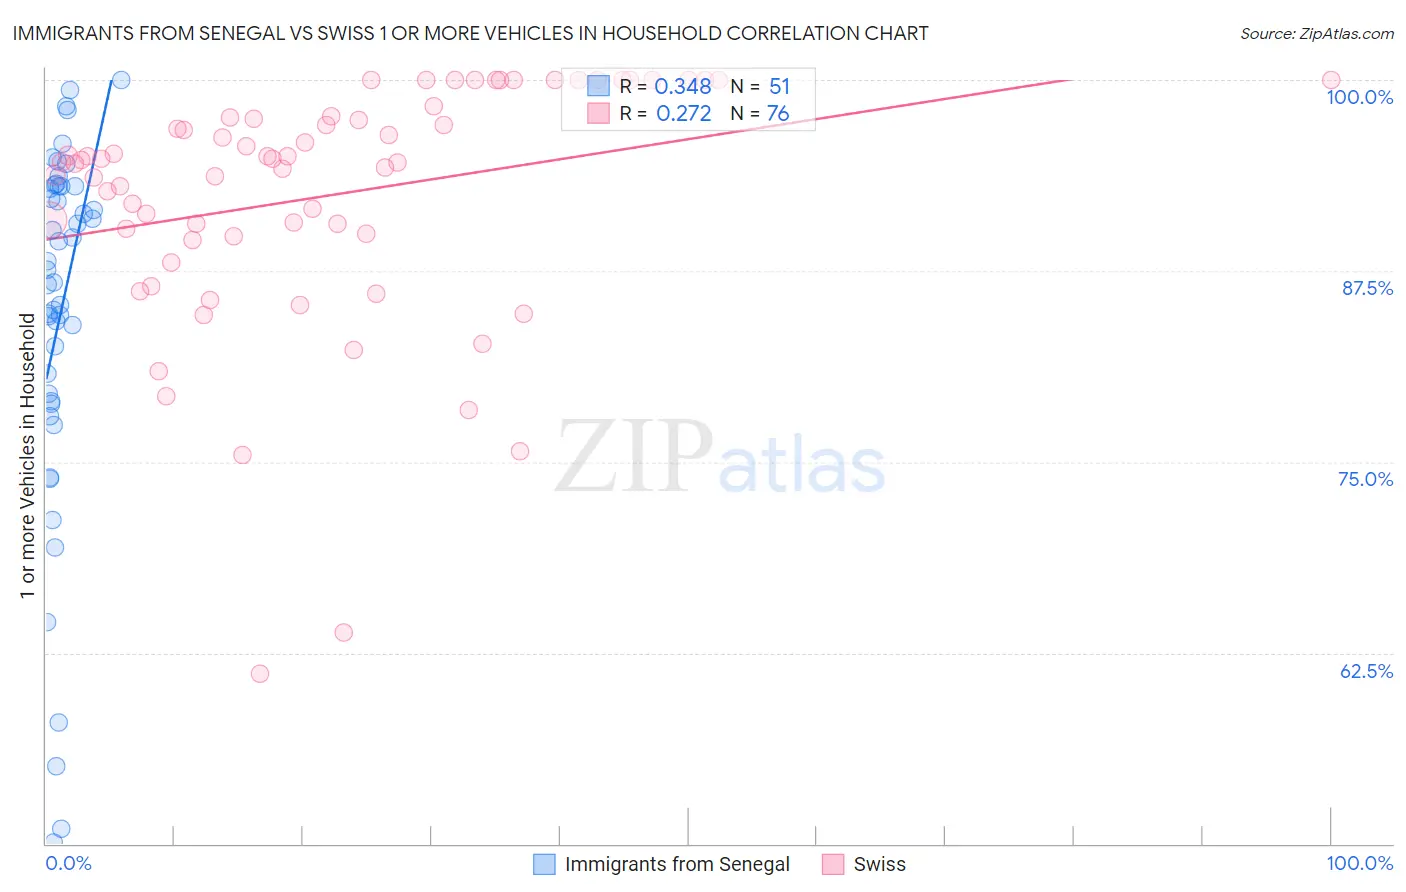
Immigrants from Senegal vs Swiss 1 or more Vehicles in Household Correlation Chart
The statistical analysis conducted on geographies consisting of 90,124,695 people shows a mild positive correlation between the proportion of Immigrants from Senegal and percentage of households with 1 or more vehicles available in the United States with a correlation coefficient (R) of 0.348 and weighted average of 79.0%. Similarly, the statistical analysis conducted on geographies consisting of 464,812,678 people shows a weak positive correlation between the proportion of Swiss and percentage of households with 1 or more vehicles available in the United States with a correlation coefficient (R) of 0.272 and weighted average of 92.3%, a difference of 16.9%.
1 or more Vehicles in Household Correlation Summary
| Measurement | Immigrants from Senegal | Swiss |
| Minimum | 50.1% | 61.1% |
| Maximum | 100.0% | 100.0% |
| Range | 49.9% | 38.9% |
| Mean | 84.5% | 92.4% |
| Median | 87.6% | 94.7% |
| Interquartile 25% (IQ1) | 79.0% | 89.9% |
| Interquartile 75% (IQ3) | 93.0% | 97.6% |
| Interquartile Range (IQR) | 14.0% | 7.7% |
| Standard Deviation (Sample) | 12.1% | 8.0% |
| Standard Deviation (Population) | 12.0% | 7.9% |
Similar Demographics by 1 or more Vehicles in Household
Demographics Similar to Immigrants from Senegal by 1 or more Vehicles in Household
In terms of 1 or more vehicles in household, the demographic groups most similar to Immigrants from Senegal are Immigrants from West Indies (79.5%, a difference of 0.63%), Ecuadorian (77.9%, a difference of 1.3%), Immigrants from Dominica (77.8%, a difference of 1.5%), Senegalese (80.4%, a difference of 1.7%), and Immigrants from Caribbean (80.4%, a difference of 1.8%).
| Demographics | Rating | Rank | 1 or more Vehicles in Household |
| Soviet Union | 0.0 /100 | #320 | Tragic 82.7% |
| Jamaicans | 0.0 /100 | #321 | Tragic 82.1% |
| Immigrants | Cabo Verde | 0.0 /100 | #322 | Tragic 81.6% |
| Immigrants | Yemen | 0.0 /100 | #323 | Tragic 80.5% |
| Immigrants | Caribbean | 0.0 /100 | #324 | Tragic 80.4% |
| Senegalese | 0.0 /100 | #325 | Tragic 80.4% |
| Immigrants | West Indies | 0.0 /100 | #326 | Tragic 79.5% |
| Immigrants | Senegal | 0.0 /100 | #327 | Tragic 79.0% |
| Ecuadorians | 0.0 /100 | #328 | Tragic 77.9% |
| Immigrants | Dominica | 0.0 /100 | #329 | Tragic 77.8% |
| Immigrants | Trinidad and Tobago | 0.0 /100 | #330 | Tragic 76.8% |
| West Indians | 0.0 /100 | #331 | Tragic 76.4% |
| Trinidadians and Tobagonians | 0.0 /100 | #332 | Tragic 76.3% |
| Immigrants | Ecuador | 0.0 /100 | #333 | Tragic 76.2% |
| Immigrants | Bangladesh | 0.0 /100 | #334 | Tragic 74.3% |
Demographics Similar to Swiss by 1 or more Vehicles in Household
In terms of 1 or more vehicles in household, the demographic groups most similar to Swiss are Creek (92.3%, a difference of 0.0%), French Canadian (92.3%, a difference of 0.010%), Immigrants from Vietnam (92.3%, a difference of 0.010%), Czechoslovakian (92.3%, a difference of 0.020%), and Malaysian (92.3%, a difference of 0.020%).
| Demographics | Rating | Rank | 1 or more Vehicles in Household |
| Basques | 100.0 /100 | #32 | Exceptional 92.4% |
| Cherokee | 100.0 /100 | #33 | Exceptional 92.4% |
| Italians | 99.9 /100 | #34 | Exceptional 92.3% |
| Czechoslovakians | 99.9 /100 | #35 | Exceptional 92.3% |
| Malaysians | 99.9 /100 | #36 | Exceptional 92.3% |
| French Canadians | 99.9 /100 | #37 | Exceptional 92.3% |
| Immigrants | Vietnam | 99.9 /100 | #38 | Exceptional 92.3% |
| Swiss | 99.9 /100 | #39 | Exceptional 92.3% |
| Creek | 99.9 /100 | #40 | Exceptional 92.3% |
| Immigrants | Taiwan | 99.9 /100 | #41 | Exceptional 92.3% |
| Chickasaw | 99.9 /100 | #42 | Exceptional 92.3% |
| Spanish | 99.9 /100 | #43 | Exceptional 92.3% |
| Choctaw | 99.9 /100 | #44 | Exceptional 92.2% |
| Immigrants | Nonimmigrants | 99.9 /100 | #45 | Exceptional 92.2% |
| Immigrants | Fiji | 99.9 /100 | #46 | Exceptional 92.2% |