Immigrants from Congo vs Swiss 1 or more Vehicles in Household
COMPARE
Immigrants from Congo
Swiss
1 or more Vehicles in Household
1 or more Vehicles in Household Comparison
Immigrants from Congo
Swiss
90.0%
1 OR MORE VEHICLES IN HOUSEHOLD
71.2/ 100
METRIC RATING
157th/ 347
METRIC RANK
92.3%
1 OR MORE VEHICLES IN HOUSEHOLD
99.9/ 100
METRIC RATING
39th/ 347
METRIC RANK
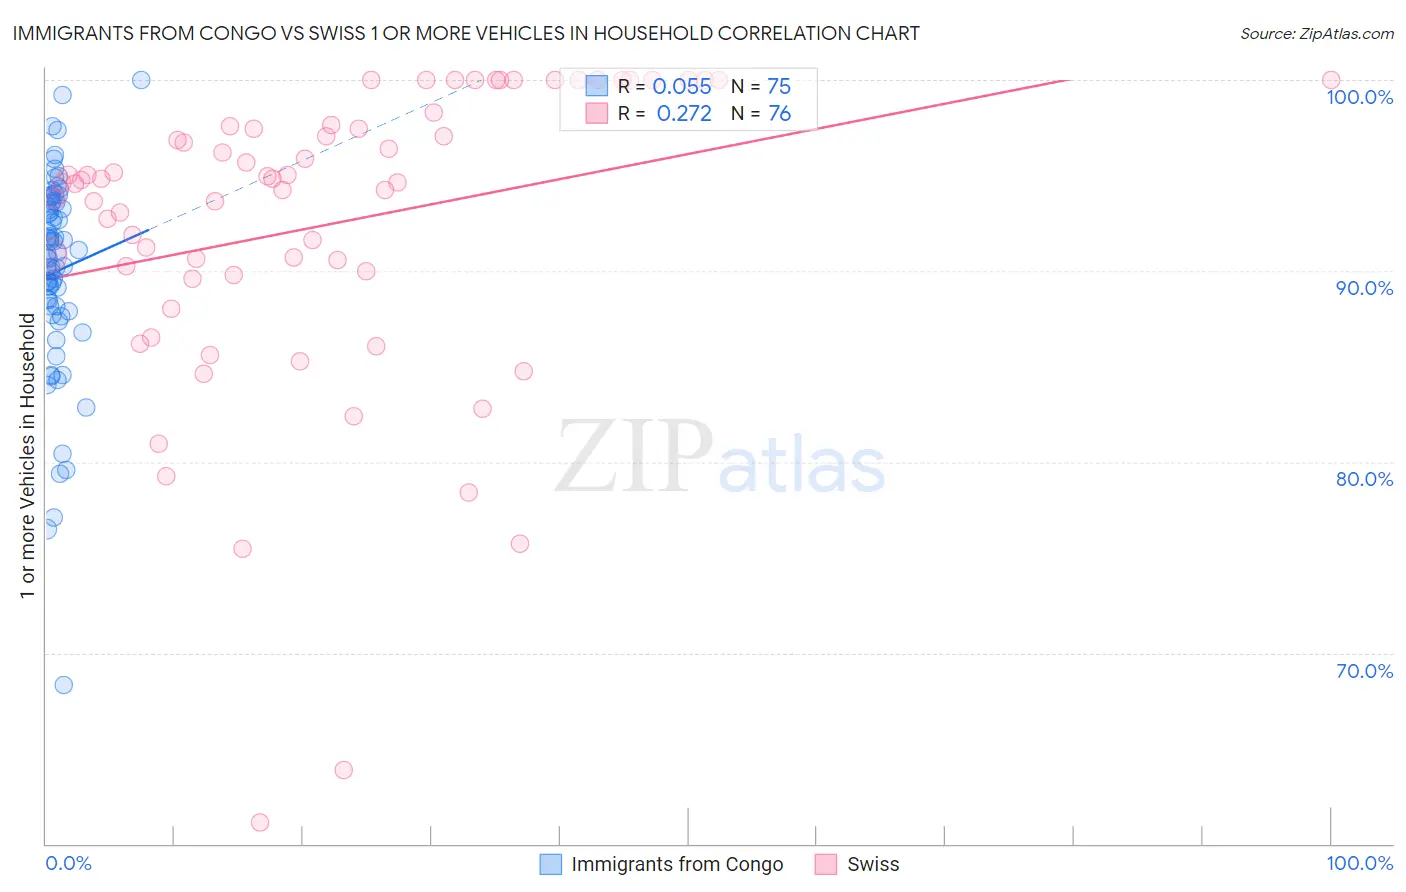
Immigrants from Congo vs Swiss 1 or more Vehicles in Household Correlation Chart
The statistical analysis conducted on geographies consisting of 92,096,115 people shows a slight positive correlation between the proportion of Immigrants from Congo and percentage of households with 1 or more vehicles available in the United States with a correlation coefficient (R) of 0.055 and weighted average of 90.0%. Similarly, the statistical analysis conducted on geographies consisting of 464,812,678 people shows a weak positive correlation between the proportion of Swiss and percentage of households with 1 or more vehicles available in the United States with a correlation coefficient (R) of 0.272 and weighted average of 92.3%, a difference of 2.5%.
1 or more Vehicles in Household Correlation Summary
| Measurement | Immigrants from Congo | Swiss |
| Minimum | 68.3% | 61.1% |
| Maximum | 100.0% | 100.0% |
| Range | 31.7% | 38.9% |
| Mean | 90.0% | 92.4% |
| Median | 90.9% | 94.7% |
| Interquartile 25% (IQ1) | 87.9% | 89.9% |
| Interquartile 75% (IQ3) | 93.6% | 97.6% |
| Interquartile Range (IQR) | 5.7% | 7.7% |
| Standard Deviation (Sample) | 5.4% | 8.0% |
| Standard Deviation (Population) | 5.3% | 7.9% |
Similar Demographics by 1 or more Vehicles in Household
Demographics Similar to Immigrants from Congo by 1 or more Vehicles in Household
In terms of 1 or more vehicles in household, the demographic groups most similar to Immigrants from Congo are Brazilian (90.0%, a difference of 0.0%), Australian (90.0%, a difference of 0.020%), South African (90.0%, a difference of 0.030%), Immigrants from Indonesia (90.0%, a difference of 0.040%), and New Zealander (90.1%, a difference of 0.050%).
| Demographics | Rating | Rank | 1 or more Vehicles in Household |
| Immigrants | Micronesia | 75.9 /100 | #150 | Good 90.1% |
| Immigrants | Bosnia and Herzegovina | 75.4 /100 | #151 | Good 90.1% |
| Tlingit-Haida | 74.3 /100 | #152 | Good 90.1% |
| New Zealanders | 73.8 /100 | #153 | Good 90.1% |
| Immigrants | Uganda | 73.8 /100 | #154 | Good 90.1% |
| Immigrants | Immigrants | 73.6 /100 | #155 | Good 90.1% |
| Australians | 72.4 /100 | #156 | Good 90.0% |
| Immigrants | Congo | 71.2 /100 | #157 | Good 90.0% |
| Brazilians | 71.0 /100 | #158 | Good 90.0% |
| South Africans | 69.7 /100 | #159 | Good 90.0% |
| Immigrants | Indonesia | 68.8 /100 | #160 | Good 90.0% |
| Salvadorans | 68.7 /100 | #161 | Good 90.0% |
| Spanish American Indians | 67.0 /100 | #162 | Good 89.9% |
| Immigrants | Austria | 65.5 /100 | #163 | Good 89.9% |
| Comanche | 63.4 /100 | #164 | Good 89.9% |
Demographics Similar to Swiss by 1 or more Vehicles in Household
In terms of 1 or more vehicles in household, the demographic groups most similar to Swiss are Creek (92.3%, a difference of 0.0%), French Canadian (92.3%, a difference of 0.010%), Immigrants from Vietnam (92.3%, a difference of 0.010%), Czechoslovakian (92.3%, a difference of 0.020%), and Malaysian (92.3%, a difference of 0.020%).
| Demographics | Rating | Rank | 1 or more Vehicles in Household |
| Basques | 100.0 /100 | #32 | Exceptional 92.4% |
| Cherokee | 100.0 /100 | #33 | Exceptional 92.4% |
| Italians | 99.9 /100 | #34 | Exceptional 92.3% |
| Czechoslovakians | 99.9 /100 | #35 | Exceptional 92.3% |
| Malaysians | 99.9 /100 | #36 | Exceptional 92.3% |
| French Canadians | 99.9 /100 | #37 | Exceptional 92.3% |
| Immigrants | Vietnam | 99.9 /100 | #38 | Exceptional 92.3% |
| Swiss | 99.9 /100 | #39 | Exceptional 92.3% |
| Creek | 99.9 /100 | #40 | Exceptional 92.3% |
| Immigrants | Taiwan | 99.9 /100 | #41 | Exceptional 92.3% |
| Chickasaw | 99.9 /100 | #42 | Exceptional 92.3% |
| Spanish | 99.9 /100 | #43 | Exceptional 92.3% |
| Choctaw | 99.9 /100 | #44 | Exceptional 92.2% |
| Immigrants | Nonimmigrants | 99.9 /100 | #45 | Exceptional 92.2% |
| Immigrants | Fiji | 99.9 /100 | #46 | Exceptional 92.2% |