Immigrants from El Salvador vs Belgian 2 or more Vehicles in Household
COMPARE
Immigrants from El Salvador
Belgian
2 or more Vehicles in Household
2 or more Vehicles in Household Comparison
Immigrants from El Salvador
Belgians
55.6%
2 OR MORE VEHICLES IN HOUSEHOLD
59.4/ 100
METRIC RATING
165th/ 347
METRIC RANK
59.3%
2 OR MORE VEHICLES IN HOUSEHOLD
99.9/ 100
METRIC RATING
49th/ 347
METRIC RANK
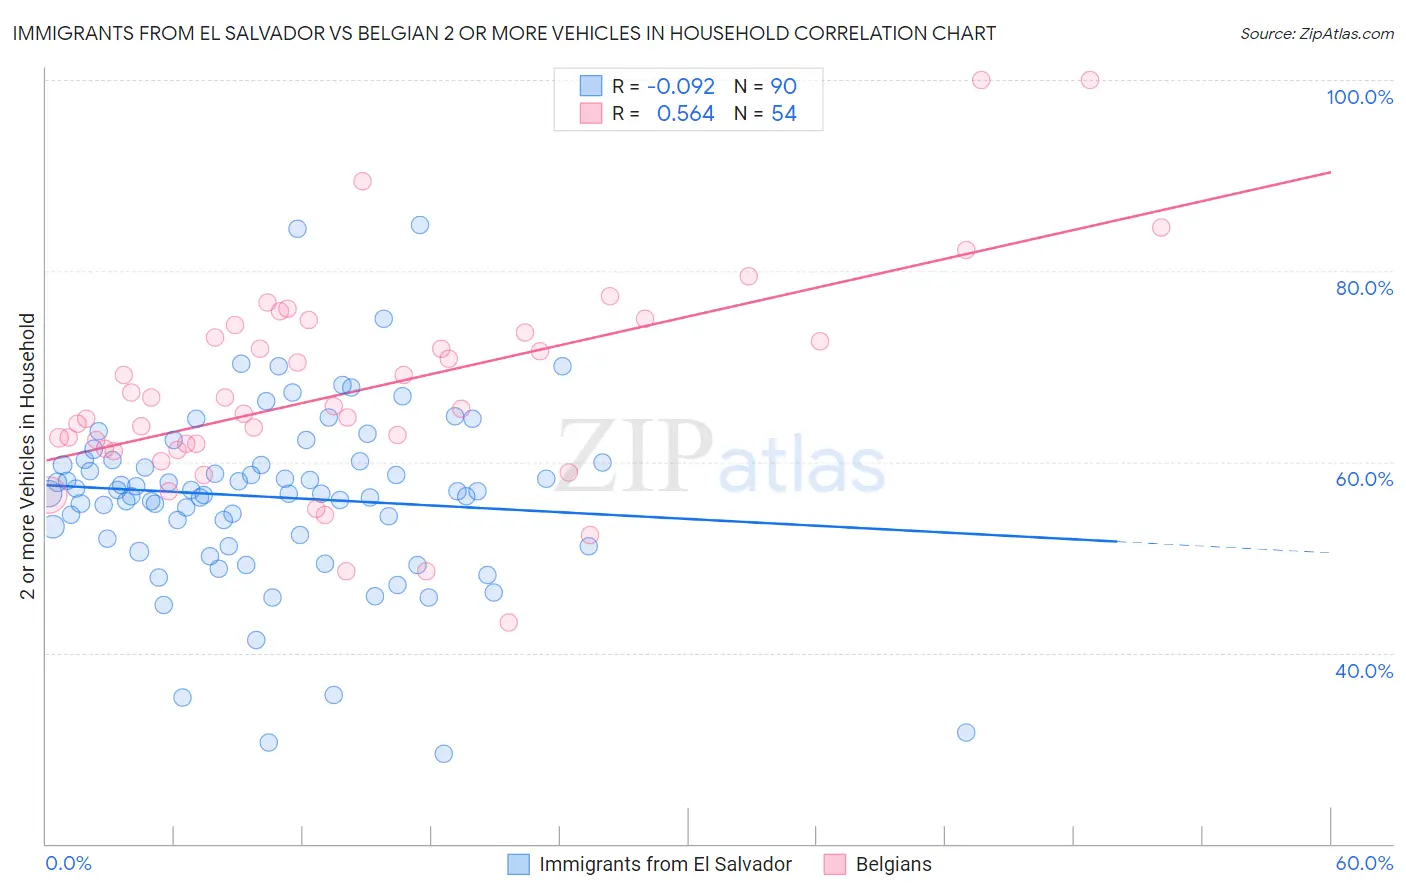
Immigrants from El Salvador vs Belgian 2 or more Vehicles in Household Correlation Chart
The statistical analysis conducted on geographies consisting of 357,715,134 people shows a slight negative correlation between the proportion of Immigrants from El Salvador and percentage of households with 2 or more vehicles available in the United States with a correlation coefficient (R) of -0.092 and weighted average of 55.6%. Similarly, the statistical analysis conducted on geographies consisting of 355,869,079 people shows a substantial positive correlation between the proportion of Belgians and percentage of households with 2 or more vehicles available in the United States with a correlation coefficient (R) of 0.564 and weighted average of 59.3%, a difference of 6.7%.
2 or more Vehicles in Household Correlation Summary
| Measurement | Immigrants from El Salvador | Belgian |
| Minimum | 29.5% | 43.1% |
| Maximum | 84.8% | 100.0% |
| Range | 55.4% | 56.9% |
| Mean | 56.3% | 67.6% |
| Median | 56.8% | 65.7% |
| Interquartile 25% (IQ1) | 51.9% | 61.3% |
| Interquartile 75% (IQ3) | 60.1% | 73.6% |
| Interquartile Range (IQR) | 8.1% | 12.3% |
| Standard Deviation (Sample) | 9.5% | 11.1% |
| Standard Deviation (Population) | 9.4% | 11.0% |
Similar Demographics by 2 or more Vehicles in Household
Demographics Similar to Immigrants from El Salvador by 2 or more Vehicles in Household
In terms of 2 or more vehicles in household, the demographic groups most similar to Immigrants from El Salvador are Dutch West Indian (55.6%, a difference of 0.020%), Immigrants from Zimbabwe (55.6%, a difference of 0.030%), Immigrants from Sri Lanka (55.5%, a difference of 0.040%), Kenyan (55.5%, a difference of 0.050%), and German Russian (55.6%, a difference of 0.060%).
| Demographics | Rating | Rank | 2 or more Vehicles in Household |
| Tlingit-Haida | 68.5 /100 | #158 | Good 55.8% |
| Paiute | 68.0 /100 | #159 | Good 55.8% |
| Crow | 67.0 /100 | #160 | Good 55.7% |
| Colville | 61.1 /100 | #161 | Good 55.6% |
| German Russians | 60.9 /100 | #162 | Good 55.6% |
| Immigrants | Zimbabwe | 60.2 /100 | #163 | Good 55.6% |
| Dutch West Indians | 59.8 /100 | #164 | Average 55.6% |
| Immigrants | El Salvador | 59.4 /100 | #165 | Average 55.6% |
| Immigrants | Sri Lanka | 58.3 /100 | #166 | Average 55.5% |
| Kenyans | 58.1 /100 | #167 | Average 55.5% |
| French American Indians | 56.7 /100 | #168 | Average 55.5% |
| Immigrants | Austria | 56.3 /100 | #169 | Average 55.5% |
| Romanians | 55.8 /100 | #170 | Average 55.5% |
| Immigrants | Costa Rica | 54.4 /100 | #171 | Average 55.4% |
| Immigrants | Nicaragua | 51.6 /100 | #172 | Average 55.4% |
Demographics Similar to Belgians by 2 or more Vehicles in Household
In terms of 2 or more vehicles in household, the demographic groups most similar to Belgians are Choctaw (59.3%, a difference of 0.010%), Immigrants from India (59.3%, a difference of 0.040%), Yaqui (59.3%, a difference of 0.060%), Spaniard (59.2%, a difference of 0.15%), and Immigrants from Laos (59.2%, a difference of 0.15%).
| Demographics | Rating | Rank | 2 or more Vehicles in Household |
| Malaysians | 100.0 /100 | #42 | Exceptional 59.8% |
| Czechoslovakians | 100.0 /100 | #43 | Exceptional 59.8% |
| French | 100.0 /100 | #44 | Exceptional 59.8% |
| Immigrants | Taiwan | 100.0 /100 | #45 | Exceptional 59.7% |
| Immigrants | South Eastern Asia | 100.0 /100 | #46 | Exceptional 59.6% |
| Yaqui | 99.9 /100 | #47 | Exceptional 59.3% |
| Immigrants | India | 99.9 /100 | #48 | Exceptional 59.3% |
| Belgians | 99.9 /100 | #49 | Exceptional 59.3% |
| Choctaw | 99.9 /100 | #50 | Exceptional 59.3% |
| Spaniards | 99.9 /100 | #51 | Exceptional 59.2% |
| Immigrants | Laos | 99.9 /100 | #52 | Exceptional 59.2% |
| Celtics | 99.9 /100 | #53 | Exceptional 59.2% |
| Bhutanese | 99.9 /100 | #54 | Exceptional 59.1% |
| Luxembourgers | 99.9 /100 | #55 | Exceptional 59.1% |
| Chickasaw | 99.9 /100 | #56 | Exceptional 59.0% |