Immigrants from Turkey vs U.S. Virgin Islander 1 or more Vehicles in Household
COMPARE
Immigrants from Turkey
U.S. Virgin Islander
1 or more Vehicles in Household
1 or more Vehicles in Household Comparison
Immigrants from Turkey
U.S. Virgin Islanders
88.6%
1 OR MORE VEHICLES IN HOUSEHOLD
4.4/ 100
METRIC RATING
237th/ 347
METRIC RANK
84.6%
1 OR MORE VEHICLES IN HOUSEHOLD
0.0/ 100
METRIC RATING
310th/ 347
METRIC RANK
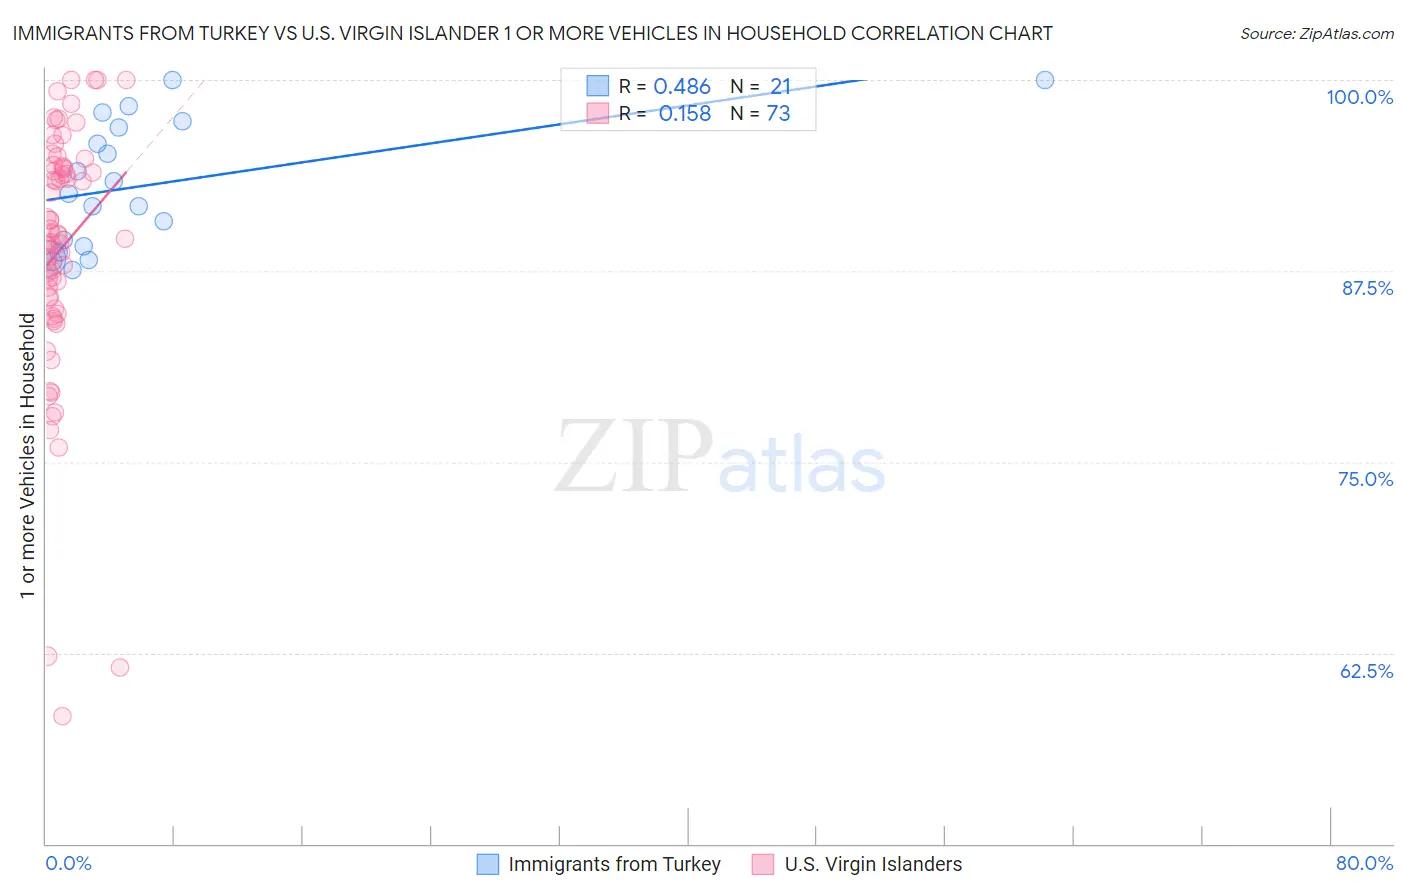
Immigrants from Turkey vs U.S. Virgin Islander 1 or more Vehicles in Household Correlation Chart
The statistical analysis conducted on geographies consisting of 222,983,528 people shows a moderate positive correlation between the proportion of Immigrants from Turkey and percentage of households with 1 or more vehicles available in the United States with a correlation coefficient (R) of 0.486 and weighted average of 88.6%. Similarly, the statistical analysis conducted on geographies consisting of 87,430,721 people shows a poor positive correlation between the proportion of U.S. Virgin Islanders and percentage of households with 1 or more vehicles available in the United States with a correlation coefficient (R) of 0.158 and weighted average of 84.6%, a difference of 4.7%.
1 or more Vehicles in Household Correlation Summary
| Measurement | Immigrants from Turkey | U.S. Virgin Islander |
| Minimum | 87.6% | 58.3% |
| Maximum | 100.0% | 100.0% |
| Range | 12.4% | 41.7% |
| Mean | 93.1% | 88.9% |
| Median | 92.5% | 89.9% |
| Interquartile 25% (IQ1) | 88.9% | 85.4% |
| Interquartile 75% (IQ3) | 97.1% | 94.3% |
| Interquartile Range (IQR) | 8.2% | 8.9% |
| Standard Deviation (Sample) | 4.2% | 8.4% |
| Standard Deviation (Population) | 4.1% | 8.3% |
Similar Demographics by 1 or more Vehicles in Household
Demographics Similar to Immigrants from Turkey by 1 or more Vehicles in Household
In terms of 1 or more vehicles in household, the demographic groups most similar to Immigrants from Turkey are Immigrants from Pakistan (88.6%, a difference of 0.010%), Paiute (88.6%, a difference of 0.020%), Immigrants from Somalia (88.6%, a difference of 0.020%), Immigrants from Peru (88.6%, a difference of 0.030%), and Houma (88.6%, a difference of 0.040%).
| Demographics | Rating | Rank | 1 or more Vehicles in Household |
| Immigrants | Sierra Leone | 5.2 /100 | #230 | Tragic 88.7% |
| Russians | 5.0 /100 | #231 | Tragic 88.7% |
| Immigrants | Japan | 4.9 /100 | #232 | Tragic 88.7% |
| Houma | 4.8 /100 | #233 | Tragic 88.6% |
| Immigrants | Peru | 4.7 /100 | #234 | Tragic 88.6% |
| Paiute | 4.6 /100 | #235 | Tragic 88.6% |
| Immigrants | Pakistan | 4.5 /100 | #236 | Tragic 88.6% |
| Immigrants | Turkey | 4.4 /100 | #237 | Tragic 88.6% |
| Immigrants | Somalia | 4.2 /100 | #238 | Tragic 88.6% |
| Kiowa | 3.8 /100 | #239 | Tragic 88.6% |
| Eastern Europeans | 3.0 /100 | #240 | Tragic 88.5% |
| Taiwanese | 2.6 /100 | #241 | Tragic 88.4% |
| Turks | 2.5 /100 | #242 | Tragic 88.4% |
| Immigrants | Belgium | 2.1 /100 | #243 | Tragic 88.4% |
| Immigrants | Portugal | 2.0 /100 | #244 | Tragic 88.3% |
Demographics Similar to U.S. Virgin Islanders by 1 or more Vehicles in Household
In terms of 1 or more vehicles in household, the demographic groups most similar to U.S. Virgin Islanders are Immigrants from Haiti (84.7%, a difference of 0.030%), Immigrants from Belize (84.7%, a difference of 0.040%), Puerto Rican (84.6%, a difference of 0.040%), Tohono O'odham (84.7%, a difference of 0.070%), and Cape Verdean (84.5%, a difference of 0.15%).
| Demographics | Rating | Rank | 1 or more Vehicles in Household |
| Immigrants | Greece | 0.0 /100 | #303 | Tragic 85.4% |
| Immigrants | Ukraine | 0.0 /100 | #304 | Tragic 85.2% |
| Immigrants | China | 0.0 /100 | #305 | Tragic 84.9% |
| Immigrants | Western Africa | 0.0 /100 | #306 | Tragic 84.9% |
| Tohono O'odham | 0.0 /100 | #307 | Tragic 84.7% |
| Immigrants | Belize | 0.0 /100 | #308 | Tragic 84.7% |
| Immigrants | Haiti | 0.0 /100 | #309 | Tragic 84.7% |
| U.S. Virgin Islanders | 0.0 /100 | #310 | Tragic 84.6% |
| Puerto Ricans | 0.0 /100 | #311 | Tragic 84.6% |
| Cape Verdeans | 0.0 /100 | #312 | Tragic 84.5% |
| Immigrants | Israel | 0.0 /100 | #313 | Tragic 84.5% |
| Albanians | 0.0 /100 | #314 | Tragic 84.4% |
| Cypriots | 0.0 /100 | #315 | Tragic 84.4% |
| Alaska Natives | 0.0 /100 | #316 | Tragic 83.8% |
| Ghanaians | 0.0 /100 | #317 | Tragic 83.6% |