Immigrants from Dominica vs Turkish 8th Grade
COMPARE
Immigrants from Dominica
Turkish
8th Grade
8th Grade Comparison
Immigrants from Dominica
Turks
94.0%
8TH GRADE
0.0/ 100
METRIC RATING
303rd/ 347
METRIC RANK
96.5%
8TH GRADE
99.2/ 100
METRIC RATING
82nd/ 347
METRIC RANK
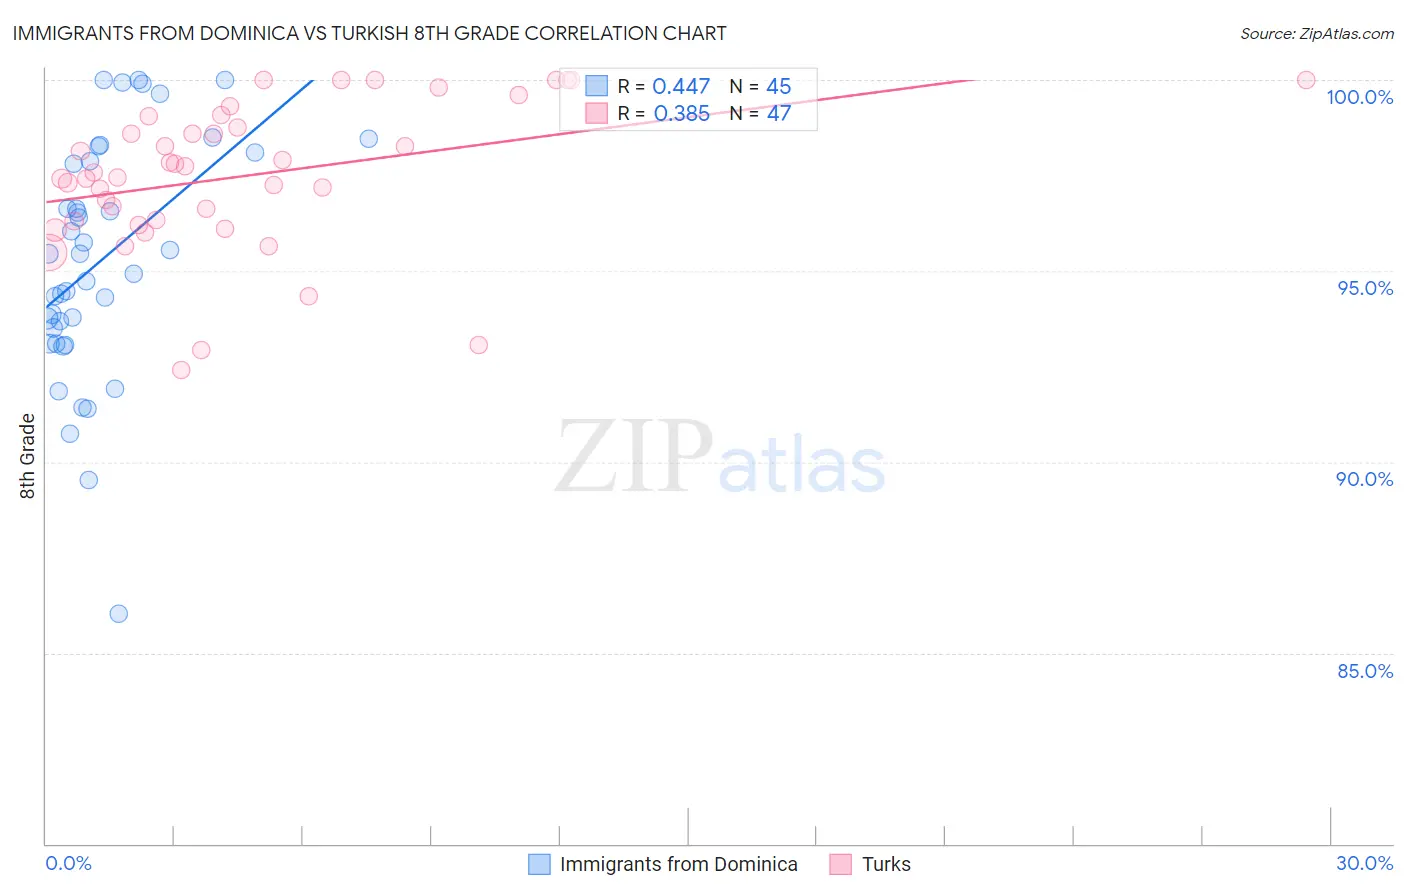
Immigrants from Dominica vs Turkish 8th Grade Correlation Chart
The statistical analysis conducted on geographies consisting of 83,794,115 people shows a moderate positive correlation between the proportion of Immigrants from Dominica and percentage of population with at least 8th grade education in the United States with a correlation coefficient (R) of 0.447 and weighted average of 94.0%. Similarly, the statistical analysis conducted on geographies consisting of 271,864,133 people shows a mild positive correlation between the proportion of Turks and percentage of population with at least 8th grade education in the United States with a correlation coefficient (R) of 0.385 and weighted average of 96.5%, a difference of 2.7%.
8th Grade Correlation Summary
| Measurement | Immigrants from Dominica | Turkish |
| Minimum | 86.0% | 92.4% |
| Maximum | 100.0% | 100.0% |
| Range | 14.0% | 7.6% |
| Mean | 95.3% | 97.5% |
| Median | 95.4% | 97.6% |
| Interquartile 25% (IQ1) | 93.3% | 96.3% |
| Interquartile 75% (IQ3) | 98.0% | 99.1% |
| Interquartile Range (IQR) | 4.7% | 2.7% |
| Standard Deviation (Sample) | 3.1% | 1.9% |
| Standard Deviation (Population) | 3.1% | 1.9% |
Similar Demographics by 8th Grade
Demographics Similar to Immigrants from Dominica by 8th Grade
In terms of 8th grade, the demographic groups most similar to Immigrants from Dominica are Sri Lankan (94.0%, a difference of 0.040%), Guyanese (93.9%, a difference of 0.080%), Immigrants from Haiti (93.9%, a difference of 0.12%), Immigrants from Laos (94.1%, a difference of 0.14%), and Immigrants from Burma/Myanmar (94.1%, a difference of 0.16%).
| Demographics | Rating | Rank | 8th Grade |
| Haitians | 0.0 /100 | #296 | Tragic 94.2% |
| Immigrants | South Eastern Asia | 0.0 /100 | #297 | Tragic 94.2% |
| Indonesians | 0.0 /100 | #298 | Tragic 94.1% |
| Cubans | 0.0 /100 | #299 | Tragic 94.1% |
| Immigrants | Burma/Myanmar | 0.0 /100 | #300 | Tragic 94.1% |
| Immigrants | Laos | 0.0 /100 | #301 | Tragic 94.1% |
| Sri Lankans | 0.0 /100 | #302 | Tragic 94.0% |
| Immigrants | Dominica | 0.0 /100 | #303 | Tragic 94.0% |
| Guyanese | 0.0 /100 | #304 | Tragic 93.9% |
| Immigrants | Haiti | 0.0 /100 | #305 | Tragic 93.9% |
| Immigrants | Guyana | 0.0 /100 | #306 | Tragic 93.8% |
| Immigrants | Portugal | 0.0 /100 | #307 | Tragic 93.8% |
| Ecuadorians | 0.0 /100 | #308 | Tragic 93.6% |
| Immigrants | Immigrants | 0.0 /100 | #309 | Tragic 93.6% |
| Japanese | 0.0 /100 | #310 | Tragic 93.6% |
Demographics Similar to Turks by 8th Grade
In terms of 8th grade, the demographic groups most similar to Turks are Romanian (96.5%, a difference of 0.0%), Delaware (96.5%, a difference of 0.010%), Icelander (96.5%, a difference of 0.010%), Puget Sound Salish (96.5%, a difference of 0.020%), and Immigrants from Belgium (96.5%, a difference of 0.020%).
| Demographics | Rating | Rank | 8th Grade |
| Zimbabweans | 99.4 /100 | #75 | Exceptional 96.5% |
| Immigrants | Netherlands | 99.4 /100 | #76 | Exceptional 96.5% |
| Cypriots | 99.4 /100 | #77 | Exceptional 96.5% |
| Yugoslavians | 99.4 /100 | #78 | Exceptional 96.5% |
| Puget Sound Salish | 99.3 /100 | #79 | Exceptional 96.5% |
| Delaware | 99.2 /100 | #80 | Exceptional 96.5% |
| Romanians | 99.2 /100 | #81 | Exceptional 96.5% |
| Turks | 99.2 /100 | #82 | Exceptional 96.5% |
| Icelanders | 99.2 /100 | #83 | Exceptional 96.5% |
| Immigrants | Belgium | 99.1 /100 | #84 | Exceptional 96.5% |
| Immigrants | South Africa | 99.1 /100 | #85 | Exceptional 96.5% |
| Cherokee | 99.0 /100 | #86 | Exceptional 96.5% |
| Immigrants | Australia | 99.0 /100 | #87 | Exceptional 96.5% |
| Immigrants | Western Europe | 99.0 /100 | #88 | Exceptional 96.4% |
| Chickasaw | 98.9 /100 | #89 | Exceptional 96.4% |