South American Indian vs Okinawan 4 or more Vehicles in Household
COMPARE
South American Indian
Okinawan
4 or more Vehicles in Household
4 or more Vehicles in Household Comparison
South American Indians
Okinawans
6.3%
4 OR MORE VEHICLES IN HOUSEHOLD
40.7/ 100
METRIC RATING
182nd/ 347
METRIC RANK
5.5%
4 OR MORE VEHICLES IN HOUSEHOLD
0.6/ 100
METRIC RATING
270th/ 347
METRIC RANK
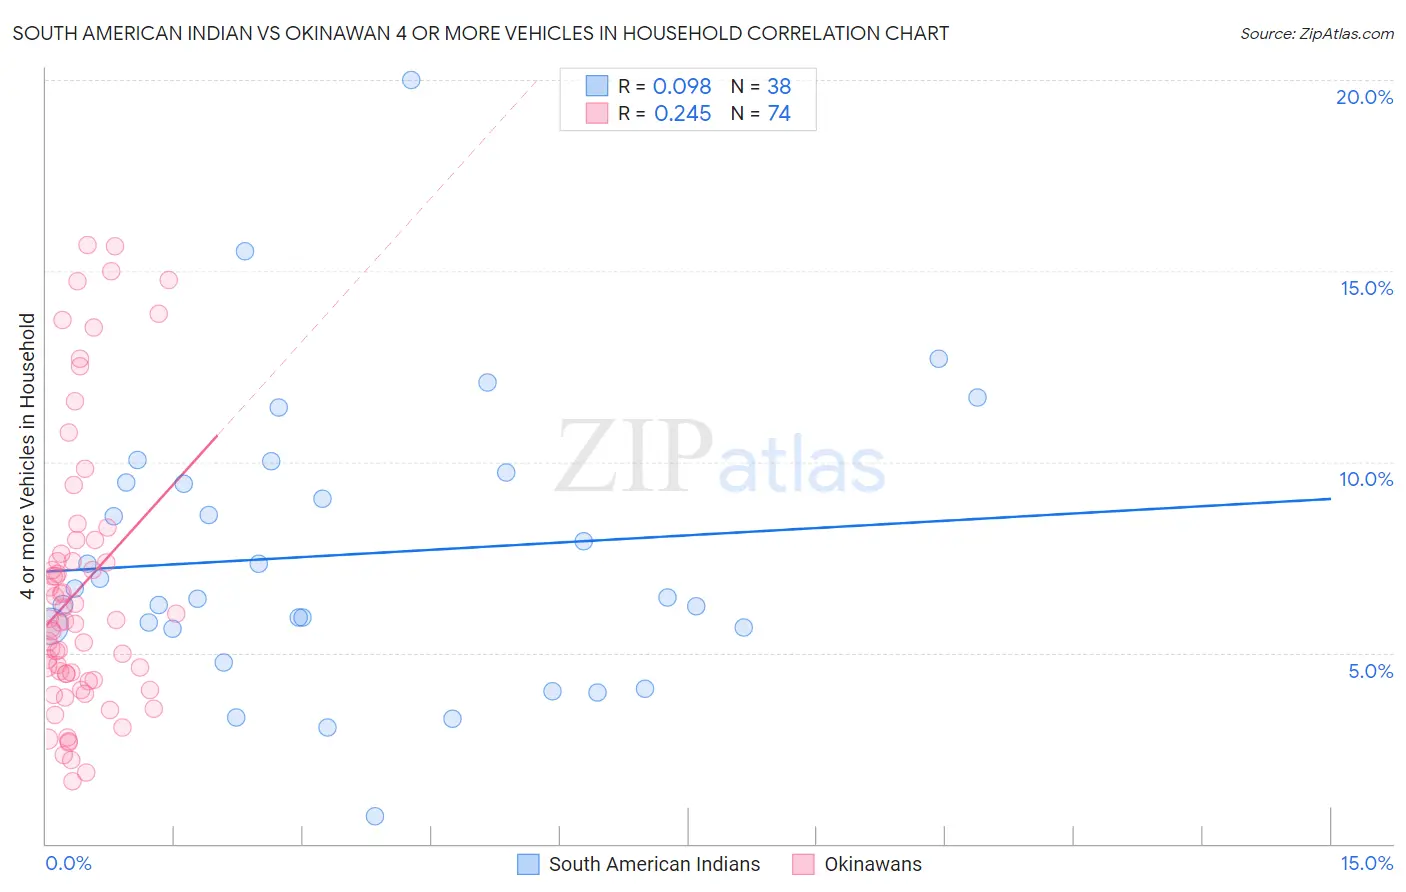
South American Indian vs Okinawan 4 or more Vehicles in Household Correlation Chart
The statistical analysis conducted on geographies consisting of 163,716,916 people shows a slight positive correlation between the proportion of South American Indians and percentage of households with 4 or more vehicles available in the United States with a correlation coefficient (R) of 0.098 and weighted average of 6.3%. Similarly, the statistical analysis conducted on geographies consisting of 73,384,410 people shows a weak positive correlation between the proportion of Okinawans and percentage of households with 4 or more vehicles available in the United States with a correlation coefficient (R) of 0.245 and weighted average of 5.5%, a difference of 13.5%.
4 or more Vehicles in Household Correlation Summary
| Measurement | South American Indian | Okinawan |
| Minimum | 0.72% | 1.6% |
| Maximum | 20.0% | 15.7% |
| Range | 19.3% | 14.0% |
| Mean | 7.6% | 6.7% |
| Median | 6.6% | 5.8% |
| Interquartile 25% (IQ1) | 5.7% | 4.3% |
| Interquartile 75% (IQ3) | 9.5% | 7.6% |
| Interquartile Range (IQR) | 3.8% | 3.3% |
| Standard Deviation (Sample) | 3.7% | 3.6% |
| Standard Deviation (Population) | 3.6% | 3.6% |
Similar Demographics by 4 or more Vehicles in Household
Demographics Similar to South American Indians by 4 or more Vehicles in Household
In terms of 4 or more vehicles in household, the demographic groups most similar to South American Indians are Yugoslavian (6.3%, a difference of 0.050%), Syrian (6.3%, a difference of 0.14%), Immigrants from Japan (6.3%, a difference of 0.25%), Immigrants from Burma/Myanmar (6.2%, a difference of 0.34%), and Iraqi (6.2%, a difference of 0.36%).
| Demographics | Rating | Rank | 4 or more Vehicles in Household |
| Immigrants | Western Europe | 48.8 /100 | #175 | Average 6.3% |
| Ukrainians | 47.6 /100 | #176 | Average 6.3% |
| Slovaks | 46.9 /100 | #177 | Average 6.3% |
| Belizeans | 44.5 /100 | #178 | Average 6.3% |
| Immigrants | Japan | 43.1 /100 | #179 | Average 6.3% |
| Syrians | 42.0 /100 | #180 | Average 6.3% |
| Yugoslavians | 41.1 /100 | #181 | Average 6.3% |
| South American Indians | 40.7 /100 | #182 | Average 6.3% |
| Immigrants | Burma/Myanmar | 37.5 /100 | #183 | Fair 6.2% |
| Iraqis | 37.3 /100 | #184 | Fair 6.2% |
| Thais | 36.9 /100 | #185 | Fair 6.2% |
| Immigrants | Northern Europe | 36.8 /100 | #186 | Fair 6.2% |
| Immigrants | South Africa | 35.4 /100 | #187 | Fair 6.2% |
| Kiowa | 34.7 /100 | #188 | Fair 6.2% |
| Immigrants | Eastern Asia | 33.3 /100 | #189 | Fair 6.2% |
Demographics Similar to Okinawans by 4 or more Vehicles in Household
In terms of 4 or more vehicles in household, the demographic groups most similar to Okinawans are Immigrants from Sudan (5.5%, a difference of 0.10%), Carpatho Rusyn (5.5%, a difference of 0.20%), Immigrants from Kazakhstan (5.5%, a difference of 0.30%), Macedonian (5.5%, a difference of 0.33%), and Colombian (5.5%, a difference of 0.36%).
| Demographics | Rating | Rank | 4 or more Vehicles in Household |
| Immigrants | Saudi Arabia | 1.1 /100 | #263 | Tragic 5.6% |
| Immigrants | Africa | 1.0 /100 | #264 | Tragic 5.6% |
| South Americans | 0.9 /100 | #265 | Tragic 5.6% |
| Immigrants | Nepal | 0.9 /100 | #266 | Tragic 5.6% |
| Immigrants | Ukraine | 0.9 /100 | #267 | Tragic 5.6% |
| Colombians | 0.7 /100 | #268 | Tragic 5.5% |
| Carpatho Rusyns | 0.7 /100 | #269 | Tragic 5.5% |
| Okinawans | 0.6 /100 | #270 | Tragic 5.5% |
| Immigrants | Sudan | 0.6 /100 | #271 | Tragic 5.5% |
| Immigrants | Kazakhstan | 0.6 /100 | #272 | Tragic 5.5% |
| Macedonians | 0.6 /100 | #273 | Tragic 5.5% |
| Blacks/African Americans | 0.6 /100 | #274 | Tragic 5.5% |
| Cambodians | 0.5 /100 | #275 | Tragic 5.5% |
| Immigrants | Latvia | 0.5 /100 | #276 | Tragic 5.5% |
| Immigrants | Bulgaria | 0.5 /100 | #277 | Tragic 5.5% |