Immigrants from Congo vs Romanian No Vehicles in Household
COMPARE
Immigrants from Congo
Romanian
No Vehicles in Household
No Vehicles in Household Comparison
Immigrants from Congo
Romanians
10.1%
NO VEHICLES IN HOUSEHOLD
73.0/ 100
METRIC RATING
152nd/ 347
METRIC RANK
10.9%
NO VEHICLES IN HOUSEHOLD
17.9/ 100
METRIC RATING
202nd/ 347
METRIC RANK
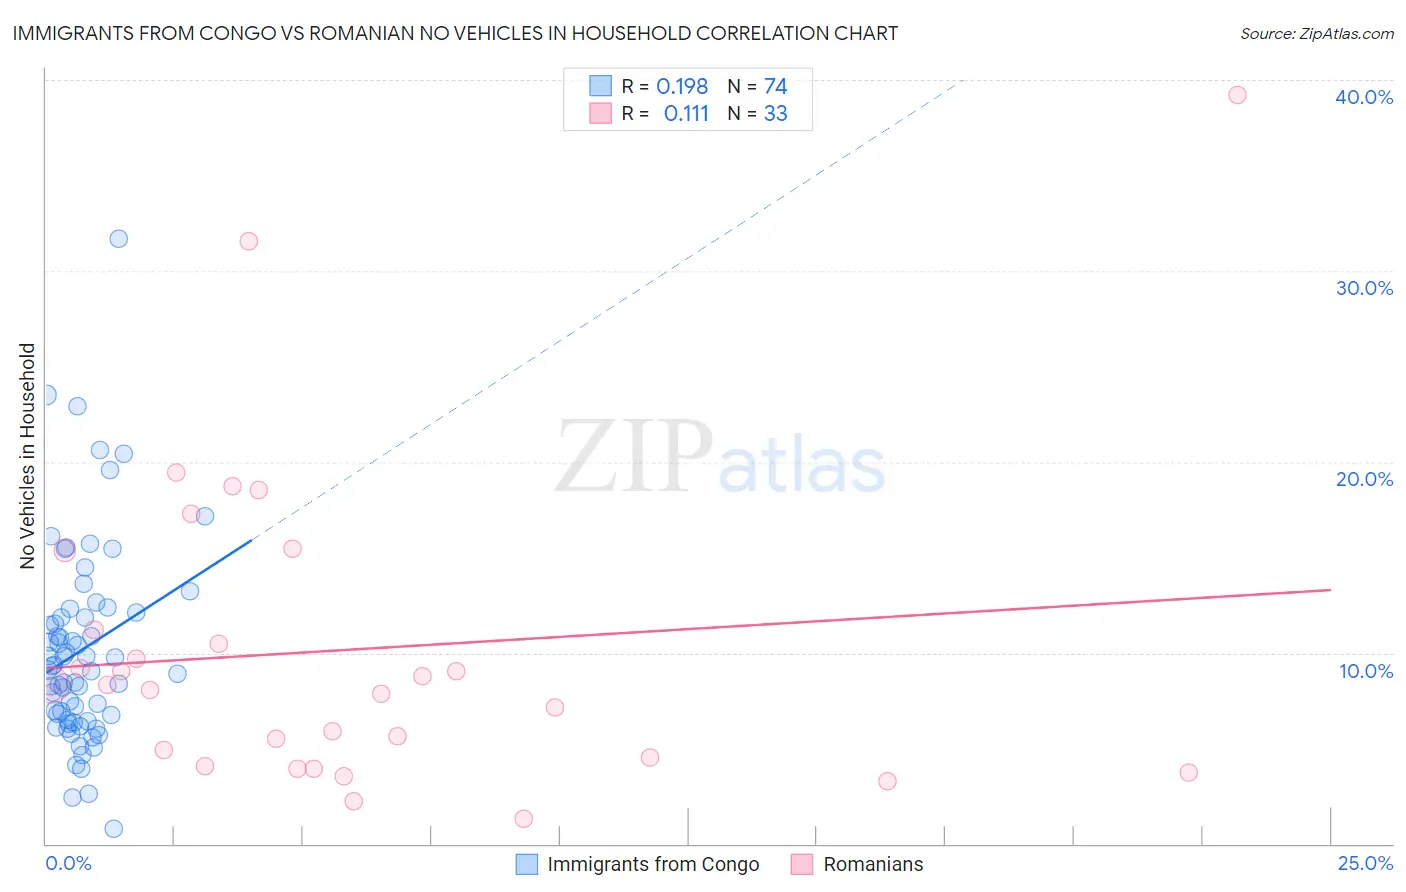
Immigrants from Congo vs Romanian No Vehicles in Household Correlation Chart
The statistical analysis conducted on geographies consisting of 92,060,649 people shows a poor positive correlation between the proportion of Immigrants from Congo and percentage of households with no vehicle available in the United States with a correlation coefficient (R) of 0.198 and weighted average of 10.1%. Similarly, the statistical analysis conducted on geographies consisting of 377,027,311 people shows a poor positive correlation between the proportion of Romanians and percentage of households with no vehicle available in the United States with a correlation coefficient (R) of 0.111 and weighted average of 10.9%, a difference of 8.8%.
No Vehicles in Household Correlation Summary
| Measurement | Immigrants from Congo | Romanian |
| Minimum | 0.81% | 1.3% |
| Maximum | 31.7% | 39.2% |
| Range | 30.9% | 37.9% |
| Mean | 10.2% | 10.2% |
| Median | 9.2% | 8.3% |
| Interquartile 25% (IQ1) | 6.5% | 4.3% |
| Interquartile 75% (IQ3) | 12.1% | 13.3% |
| Interquartile Range (IQR) | 5.7% | 9.0% |
| Standard Deviation (Sample) | 5.3% | 8.2% |
| Standard Deviation (Population) | 5.2% | 8.1% |
Similar Demographics by No Vehicles in Household
Demographics Similar to Immigrants from Congo by No Vehicles in Household
In terms of no vehicles in household, the demographic groups most similar to Immigrants from Congo are Tlingit-Haida (10.1%, a difference of 0.090%), Sioux (10.1%, a difference of 0.11%), Salvadoran (10.1%, a difference of 0.12%), Immigrants from Eastern Africa (10.0%, a difference of 0.14%), and Colombian (10.0%, a difference of 0.15%).
| Demographics | Rating | Rank | No Vehicles in Household |
| Bahamians | 81.0 /100 | #145 | Excellent 9.9% |
| Hungarians | 80.0 /100 | #146 | Excellent 9.9% |
| Immigrants | Nicaragua | 79.8 /100 | #147 | Good 9.9% |
| Immigrants | Bosnia and Herzegovina | 79.1 /100 | #148 | Good 9.9% |
| Immigrants | Uganda | 76.1 /100 | #149 | Good 10.0% |
| Colombians | 73.9 /100 | #150 | Good 10.0% |
| Immigrants | Eastern Africa | 73.8 /100 | #151 | Good 10.0% |
| Immigrants | Congo | 73.0 /100 | #152 | Good 10.1% |
| Tlingit-Haida | 72.5 /100 | #153 | Good 10.1% |
| Sioux | 72.4 /100 | #154 | Good 10.1% |
| Salvadorans | 72.4 /100 | #155 | Good 10.1% |
| Immigrants | Micronesia | 70.9 /100 | #156 | Good 10.1% |
| Australians | 70.6 /100 | #157 | Good 10.1% |
| Spanish American Indians | 70.2 /100 | #158 | Good 10.1% |
| Immigrants | Indonesia | 69.3 /100 | #159 | Good 10.1% |
Demographics Similar to Romanians by No Vehicles in Household
In terms of no vehicles in household, the demographic groups most similar to Romanians are Iroquois (10.9%, a difference of 0.070%), Immigrants from Western Europe (10.9%, a difference of 0.27%), Cambodian (10.9%, a difference of 0.38%), Guatemalan (11.0%, a difference of 0.41%), and Immigrants from Chile (11.0%, a difference of 0.45%).
| Demographics | Rating | Rank | No Vehicles in Household |
| Immigrants | Brazil | 26.3 /100 | #195 | Fair 10.8% |
| Central Americans | 24.3 /100 | #196 | Fair 10.8% |
| Shoshone | 24.1 /100 | #197 | Fair 10.8% |
| Immigrants | Sweden | 22.9 /100 | #198 | Fair 10.8% |
| Immigrants | Asia | 21.3 /100 | #199 | Fair 10.9% |
| Cambodians | 19.6 /100 | #200 | Poor 10.9% |
| Immigrants | Western Europe | 19.1 /100 | #201 | Poor 10.9% |
| Romanians | 17.9 /100 | #202 | Poor 10.9% |
| Iroquois | 17.6 /100 | #203 | Poor 10.9% |
| Guatemalans | 16.1 /100 | #204 | Poor 11.0% |
| Immigrants | Chile | 15.9 /100 | #205 | Poor 11.0% |
| Somalis | 15.9 /100 | #206 | Poor 11.0% |
| Sierra Leoneans | 15.7 /100 | #207 | Poor 11.0% |
| Immigrants | Italy | 15.6 /100 | #208 | Poor 11.0% |
| Pennsylvania Germans | 15.5 /100 | #209 | Poor 11.0% |