Immigrants from Chile vs Nepalese 2 or more Vehicles in Household
COMPARE
Immigrants from Chile
Nepalese
2 or more Vehicles in Household
2 or more Vehicles in Household Comparison
Immigrants from Chile
Nepalese
54.2%
2 OR MORE VEHICLES IN HOUSEHOLD
11.1/ 100
METRIC RATING
212th/ 347
METRIC RANK
61.4%
2 OR MORE VEHICLES IN HOUSEHOLD
100.0/ 100
METRIC RATING
15th/ 347
METRIC RANK
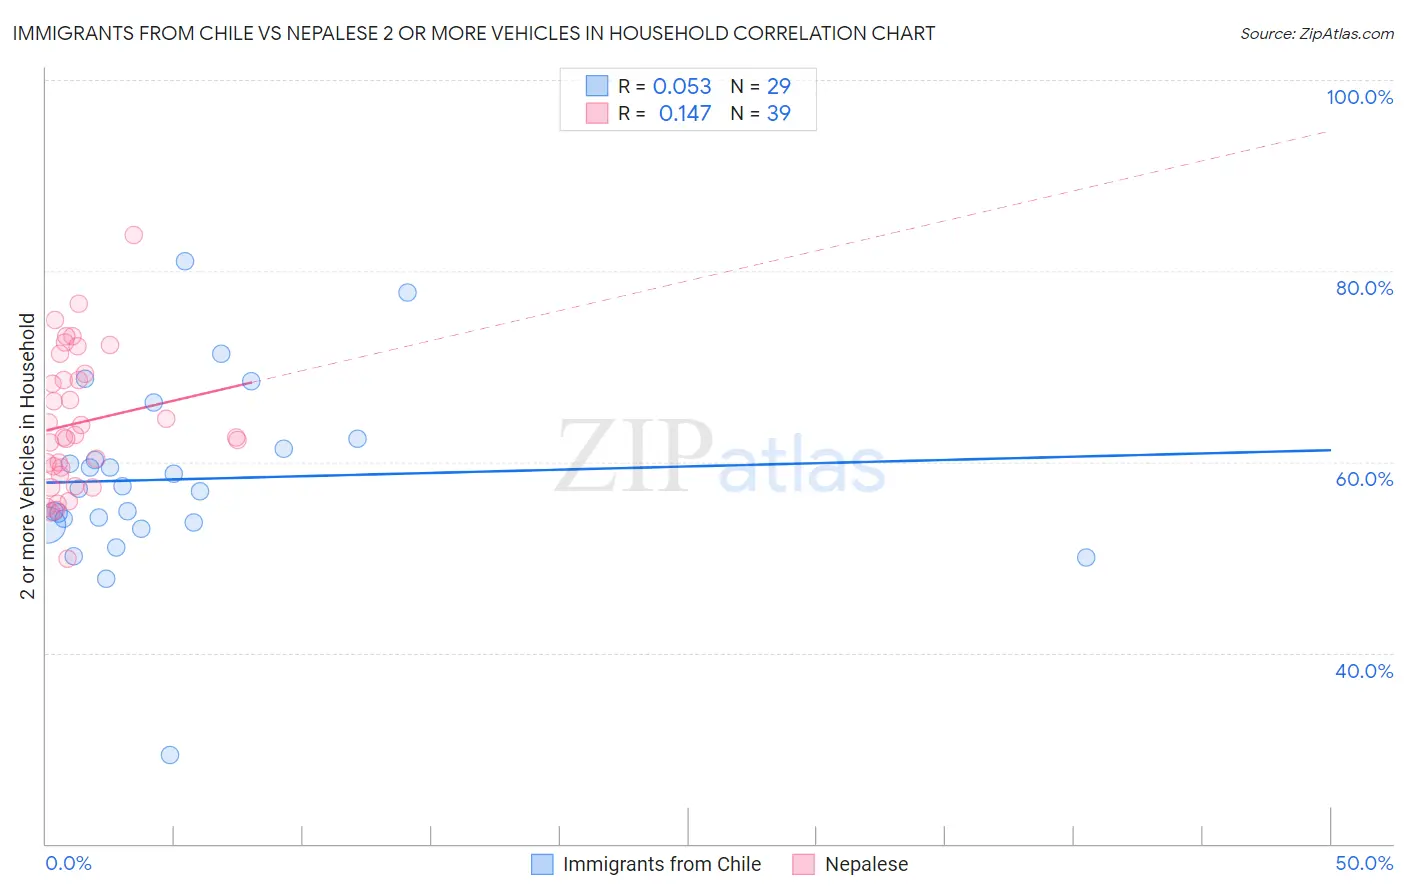
Immigrants from Chile vs Nepalese 2 or more Vehicles in Household Correlation Chart
The statistical analysis conducted on geographies consisting of 218,607,451 people shows a slight positive correlation between the proportion of Immigrants from Chile and percentage of households with 2 or more vehicles available in the United States with a correlation coefficient (R) of 0.053 and weighted average of 54.2%. Similarly, the statistical analysis conducted on geographies consisting of 24,483,296 people shows a poor positive correlation between the proportion of Nepalese and percentage of households with 2 or more vehicles available in the United States with a correlation coefficient (R) of 0.147 and weighted average of 61.4%, a difference of 13.3%.
2 or more Vehicles in Household Correlation Summary
| Measurement | Immigrants from Chile | Nepalese |
| Minimum | 29.3% | 49.8% |
| Maximum | 81.0% | 83.8% |
| Range | 51.7% | 33.9% |
| Mean | 58.2% | 64.1% |
| Median | 57.2% | 62.5% |
| Interquartile 25% (IQ1) | 53.5% | 58.6% |
| Interquartile 75% (IQ3) | 61.9% | 69.3% |
| Interquartile Range (IQR) | 8.4% | 10.7% |
| Standard Deviation (Sample) | 9.8% | 7.3% |
| Standard Deviation (Population) | 9.6% | 7.2% |
Similar Demographics by 2 or more Vehicles in Household
Demographics Similar to Immigrants from Chile by 2 or more Vehicles in Household
In terms of 2 or more vehicles in household, the demographic groups most similar to Immigrants from Chile are Immigrants from Hungary (54.2%, a difference of 0.020%), Immigrants from Saudi Arabia (54.2%, a difference of 0.030%), Egyptian (54.3%, a difference of 0.090%), Immigrants from Bulgaria (54.3%, a difference of 0.090%), and Guatemalan (54.1%, a difference of 0.16%).
| Demographics | Rating | Rank | 2 or more Vehicles in Household |
| Cheyenne | 13.6 /100 | #205 | Poor 54.3% |
| Immigrants | Latin America | 13.1 /100 | #206 | Poor 54.3% |
| Turks | 13.0 /100 | #207 | Poor 54.3% |
| Egyptians | 12.0 /100 | #208 | Poor 54.3% |
| Immigrants | Bulgaria | 12.0 /100 | #209 | Poor 54.3% |
| Immigrants | Saudi Arabia | 11.3 /100 | #210 | Poor 54.2% |
| Immigrants | Hungary | 11.3 /100 | #211 | Poor 54.2% |
| Immigrants | Chile | 11.1 /100 | #212 | Poor 54.2% |
| Guatemalans | 9.6 /100 | #213 | Tragic 54.1% |
| Immigrants | Czechoslovakia | 9.4 /100 | #214 | Tragic 54.1% |
| Aleuts | 9.3 /100 | #215 | Tragic 54.1% |
| Immigrants | Western Asia | 9.3 /100 | #216 | Tragic 54.1% |
| Immigrants | Burma/Myanmar | 7.1 /100 | #217 | Tragic 53.9% |
| Immigrants | Argentina | 6.8 /100 | #218 | Tragic 53.9% |
| South American Indians | 6.5 /100 | #219 | Tragic 53.9% |
Demographics Similar to Nepalese by 2 or more Vehicles in Household
In terms of 2 or more vehicles in household, the demographic groups most similar to Nepalese are Native Hawaiian (61.4%, a difference of 0.020%), Czech (61.5%, a difference of 0.090%), Basque (61.4%, a difference of 0.090%), European (61.4%, a difference of 0.10%), and Samoan (61.5%, a difference of 0.14%).
| Demographics | Rating | Rank | 2 or more Vehicles in Household |
| English | 100.0 /100 | #8 | Exceptional 61.9% |
| Swedes | 100.0 /100 | #9 | Exceptional 61.8% |
| Mexicans | 100.0 /100 | #10 | Exceptional 61.7% |
| Dutch | 100.0 /100 | #11 | Exceptional 61.6% |
| Germans | 100.0 /100 | #12 | Exceptional 61.6% |
| Samoans | 100.0 /100 | #13 | Exceptional 61.5% |
| Czechs | 100.0 /100 | #14 | Exceptional 61.5% |
| Nepalese | 100.0 /100 | #15 | Exceptional 61.4% |
| Native Hawaiians | 100.0 /100 | #16 | Exceptional 61.4% |
| Basques | 100.0 /100 | #17 | Exceptional 61.4% |
| Europeans | 100.0 /100 | #18 | Exceptional 61.4% |
| Scottish | 100.0 /100 | #19 | Exceptional 61.2% |
| Sri Lankans | 100.0 /100 | #20 | Exceptional 61.0% |
| Koreans | 100.0 /100 | #21 | Exceptional 61.0% |
| Swiss | 100.0 /100 | #22 | Exceptional 61.0% |