Immigrants from Chile vs Nepalese Ambulatory Disability
COMPARE
Immigrants from Chile
Nepalese
Ambulatory Disability
Ambulatory Disability Comparison
Immigrants from Chile
Nepalese
5.8%
AMBULATORY DISABILITY
98.9/ 100
METRIC RATING
87th/ 347
METRIC RANK
6.6%
AMBULATORY DISABILITY
0.2/ 100
METRIC RATING
264th/ 347
METRIC RANK
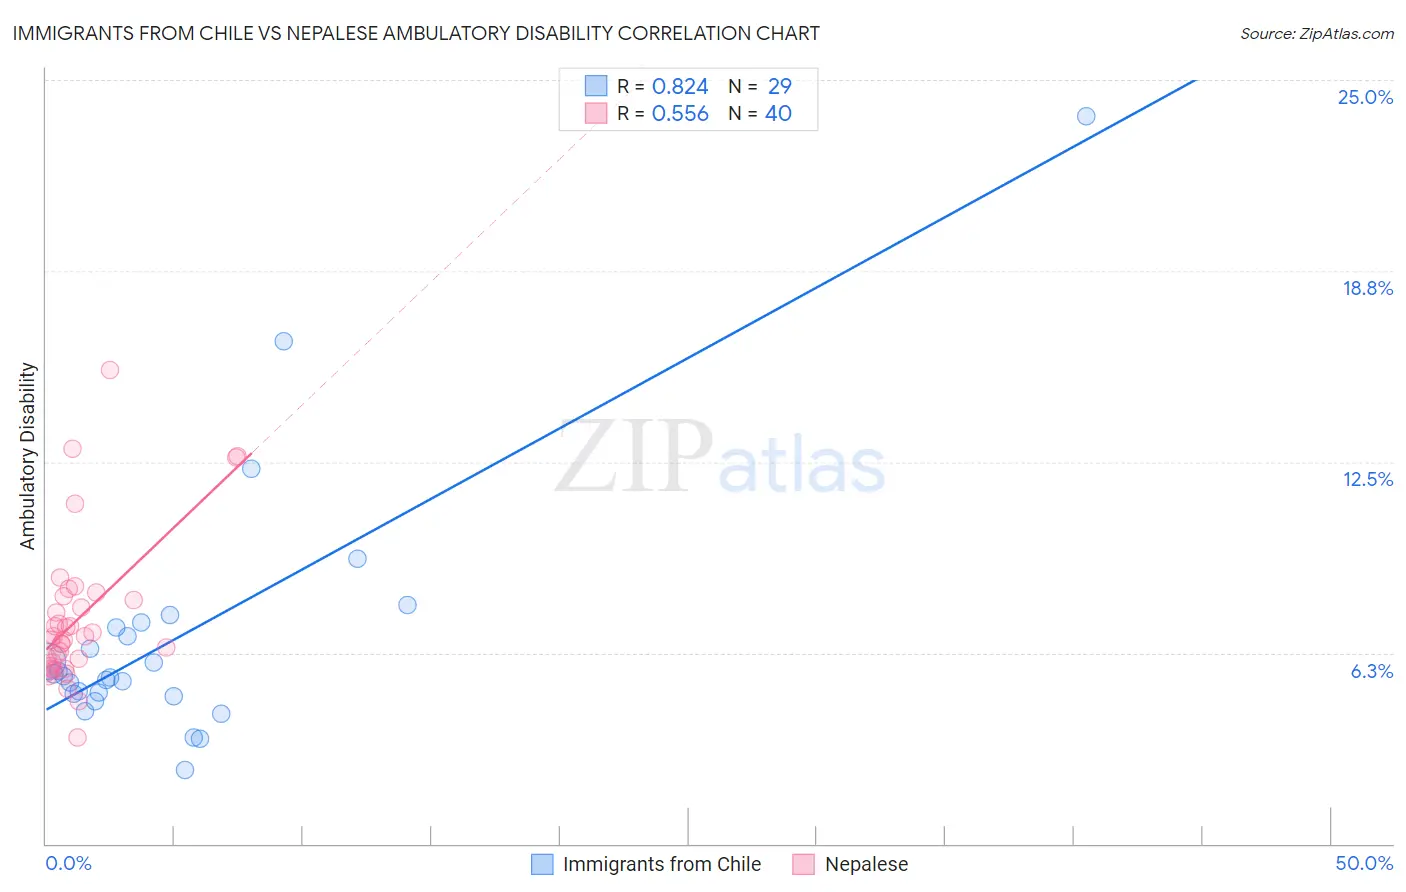
Immigrants from Chile vs Nepalese Ambulatory Disability Correlation Chart
The statistical analysis conducted on geographies consisting of 218,629,833 people shows a very strong positive correlation between the proportion of Immigrants from Chile and percentage of population with ambulatory disability in the United States with a correlation coefficient (R) of 0.824 and weighted average of 5.8%. Similarly, the statistical analysis conducted on geographies consisting of 24,521,755 people shows a substantial positive correlation between the proportion of Nepalese and percentage of population with ambulatory disability in the United States with a correlation coefficient (R) of 0.556 and weighted average of 6.6%, a difference of 14.9%.
Ambulatory Disability Correlation Summary
| Measurement | Immigrants from Chile | Nepalese |
| Minimum | 2.4% | 3.5% |
| Maximum | 23.8% | 15.5% |
| Range | 21.4% | 12.0% |
| Mean | 6.8% | 7.4% |
| Median | 5.5% | 6.7% |
| Interquartile 25% (IQ1) | 4.9% | 5.9% |
| Interquartile 75% (IQ3) | 7.2% | 8.0% |
| Interquartile Range (IQR) | 2.3% | 2.2% |
| Standard Deviation (Sample) | 4.3% | 2.4% |
| Standard Deviation (Population) | 4.2% | 2.4% |
Similar Demographics by Ambulatory Disability
Demographics Similar to Immigrants from Chile by Ambulatory Disability
In terms of ambulatory disability, the demographic groups most similar to Immigrants from Chile are Soviet Union (5.8%, a difference of 0.040%), Latvian (5.7%, a difference of 0.060%), South American (5.7%, a difference of 0.090%), Bhutanese (5.8%, a difference of 0.16%), and Australian (5.8%, a difference of 0.16%).
| Demographics | Rating | Rank | Ambulatory Disability |
| Immigrants | Ireland | 99.2 /100 | #80 | Exceptional 5.7% |
| Immigrants | Jordan | 99.2 /100 | #81 | Exceptional 5.7% |
| Palestinians | 99.2 /100 | #82 | Exceptional 5.7% |
| Eastern Europeans | 99.2 /100 | #83 | Exceptional 5.7% |
| Ugandans | 99.2 /100 | #84 | Exceptional 5.7% |
| South Americans | 99.0 /100 | #85 | Exceptional 5.7% |
| Latvians | 99.0 /100 | #86 | Exceptional 5.7% |
| Immigrants | Chile | 98.9 /100 | #87 | Exceptional 5.8% |
| Soviet Union | 98.9 /100 | #88 | Exceptional 5.8% |
| Bhutanese | 98.8 /100 | #89 | Exceptional 5.8% |
| Australians | 98.8 /100 | #90 | Exceptional 5.8% |
| Immigrants | Sudan | 98.8 /100 | #91 | Exceptional 5.8% |
| Immigrants | Sierra Leone | 98.6 /100 | #92 | Exceptional 5.8% |
| Immigrants | Denmark | 98.6 /100 | #93 | Exceptional 5.8% |
| Kenyans | 98.4 /100 | #94 | Exceptional 5.8% |
Demographics Similar to Nepalese by Ambulatory Disability
In terms of ambulatory disability, the demographic groups most similar to Nepalese are Bahamian (6.6%, a difference of 0.060%), Guyanese (6.6%, a difference of 0.18%), Trinidadian and Tobagonian (6.6%, a difference of 0.31%), Spanish (6.6%, a difference of 0.33%), and Hmong (6.6%, a difference of 0.40%).
| Demographics | Rating | Rank | Ambulatory Disability |
| Bermudans | 0.5 /100 | #257 | Tragic 6.5% |
| Spanish American Indians | 0.5 /100 | #258 | Tragic 6.5% |
| Aleuts | 0.4 /100 | #259 | Tragic 6.6% |
| Immigrants | Belize | 0.4 /100 | #260 | Tragic 6.6% |
| Irish | 0.4 /100 | #261 | Tragic 6.6% |
| English | 0.4 /100 | #262 | Tragic 6.6% |
| Hmong | 0.3 /100 | #263 | Tragic 6.6% |
| Nepalese | 0.2 /100 | #264 | Tragic 6.6% |
| Bahamians | 0.2 /100 | #265 | Tragic 6.6% |
| Guyanese | 0.2 /100 | #266 | Tragic 6.6% |
| Trinidadians and Tobagonians | 0.2 /100 | #267 | Tragic 6.6% |
| Spanish | 0.2 /100 | #268 | Tragic 6.6% |
| French | 0.1 /100 | #269 | Tragic 6.6% |
| Slovaks | 0.1 /100 | #270 | Tragic 6.7% |
| Immigrants | Trinidad and Tobago | 0.1 /100 | #271 | Tragic 6.7% |