Immigrants from Caribbean vs Immigrants from Kazakhstan Family Households with Children
COMPARE
Immigrants from Caribbean
Immigrants from Kazakhstan
Family Households with Children
Family Households with Children Comparison
Immigrants from Caribbean
Immigrants from Kazakhstan
27.0%
FAMILY HOUSEHOLDS WITH CHILDREN
6.3/ 100
METRIC RATING
229th/ 347
METRIC RANK
26.9%
FAMILY HOUSEHOLDS WITH CHILDREN
2.2/ 100
METRIC RATING
248th/ 347
METRIC RANK
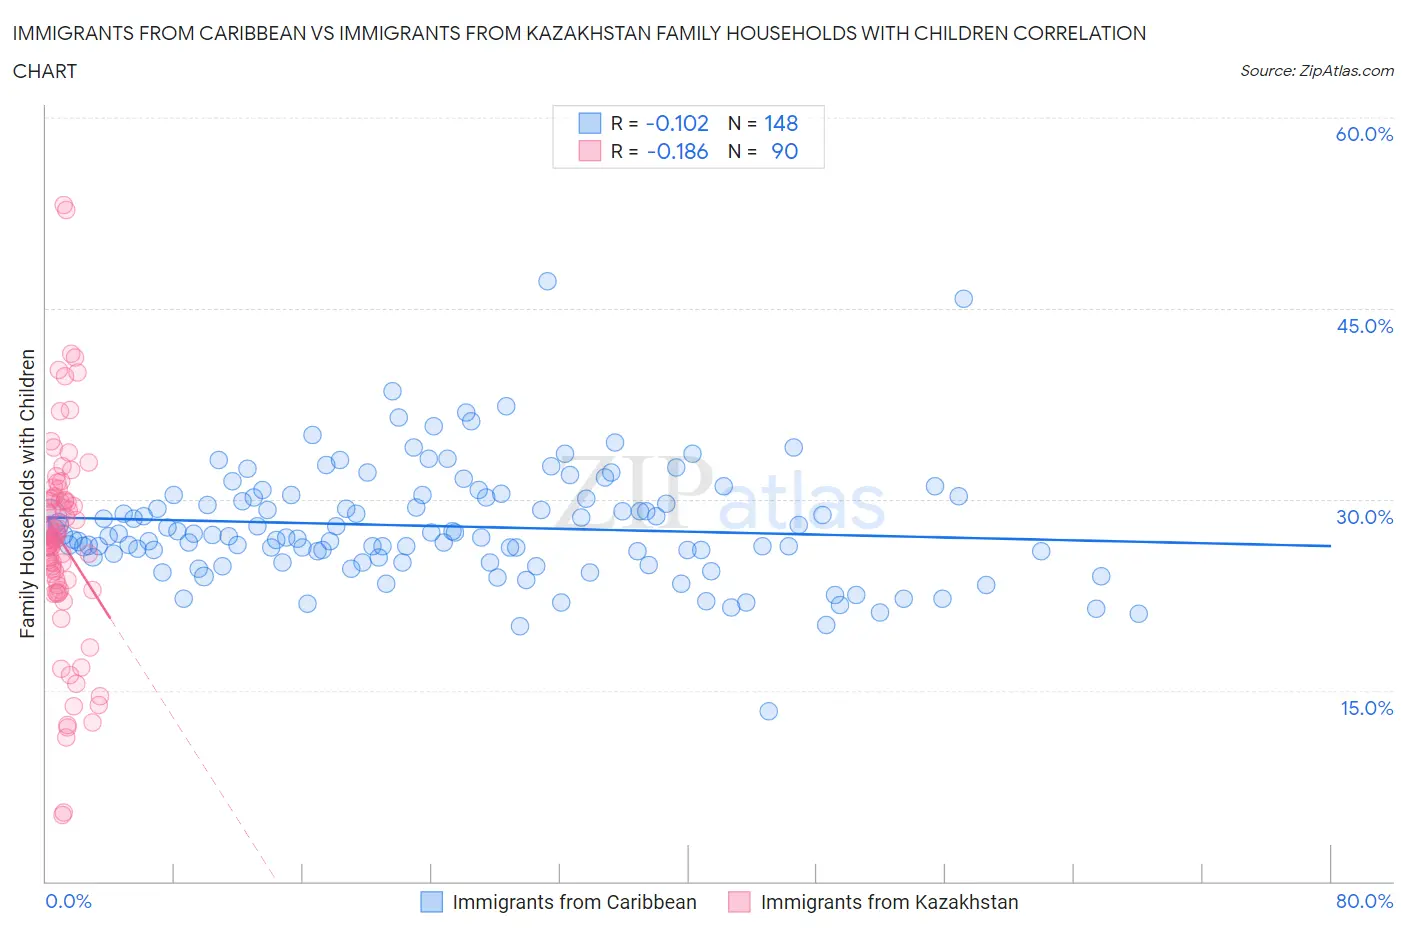
Immigrants from Caribbean vs Immigrants from Kazakhstan Family Households with Children Correlation Chart
The statistical analysis conducted on geographies consisting of 449,473,851 people shows a poor negative correlation between the proportion of Immigrants from Caribbean and percentage of family households with children in the United States with a correlation coefficient (R) of -0.102 and weighted average of 27.0%. Similarly, the statistical analysis conducted on geographies consisting of 124,425,181 people shows a poor negative correlation between the proportion of Immigrants from Kazakhstan and percentage of family households with children in the United States with a correlation coefficient (R) of -0.186 and weighted average of 26.9%, a difference of 0.62%.
Family Households with Children Correlation Summary
| Measurement | Immigrants from Caribbean | Immigrants from Kazakhstan |
| Minimum | 13.4% | 5.2% |
| Maximum | 47.1% | 53.2% |
| Range | 33.7% | 48.0% |
| Mean | 27.9% | 26.7% |
| Median | 27.2% | 26.8% |
| Interquartile 25% (IQ1) | 25.4% | 23.3% |
| Interquartile 75% (IQ3) | 30.2% | 30.0% |
| Interquartile Range (IQR) | 4.8% | 6.7% |
| Standard Deviation (Sample) | 4.5% | 8.2% |
| Standard Deviation (Population) | 4.5% | 8.2% |
Demographics Similar to Immigrants from Caribbean and Immigrants from Kazakhstan by Family Households with Children
In terms of family households with children, the demographic groups most similar to Immigrants from Caribbean are Scottish (27.0%, a difference of 0.030%), Bulgarian (27.0%, a difference of 0.050%), Luxembourger (27.0%, a difference of 0.080%), Yugoslavian (27.0%, a difference of 0.13%), and Immigrants from Italy (27.0%, a difference of 0.13%). Similarly, the demographic groups most similar to Immigrants from Kazakhstan are Potawatomi (26.9%, a difference of 0.010%), Jamaican (26.9%, a difference of 0.070%), Australian (26.9%, a difference of 0.15%), Ukrainian (26.9%, a difference of 0.16%), and Immigrants from Saudi Arabia (26.9%, a difference of 0.18%).
| Demographics | Rating | Rank | Family Households with Children |
| Scottish | 6.5 /100 | #228 | Tragic 27.0% |
| Immigrants | Caribbean | 6.3 /100 | #229 | Tragic 27.0% |
| Bulgarians | 5.8 /100 | #230 | Tragic 27.0% |
| Luxembourgers | 5.5 /100 | #231 | Tragic 27.0% |
| Yugoslavians | 5.1 /100 | #232 | Tragic 27.0% |
| Immigrants | Italy | 5.0 /100 | #233 | Tragic 27.0% |
| Immigrants | Germany | 4.4 /100 | #234 | Tragic 27.0% |
| Immigrants | Morocco | 4.2 /100 | #235 | Tragic 27.0% |
| Cape Verdeans | 3.6 /100 | #236 | Tragic 26.9% |
| Immigrants | Netherlands | 3.5 /100 | #237 | Tragic 26.9% |
| Moroccans | 3.4 /100 | #238 | Tragic 26.9% |
| Immigrants | Southern Europe | 3.4 /100 | #239 | Tragic 26.9% |
| Immigrants | Bulgaria | 3.3 /100 | #240 | Tragic 26.9% |
| Navajo | 3.2 /100 | #241 | Tragic 26.9% |
| Immigrants | England | 3.2 /100 | #242 | Tragic 26.9% |
| Immigrants | Saudi Arabia | 2.9 /100 | #243 | Tragic 26.9% |
| Ukrainians | 2.9 /100 | #244 | Tragic 26.9% |
| Australians | 2.8 /100 | #245 | Tragic 26.9% |
| Jamaicans | 2.5 /100 | #246 | Tragic 26.9% |
| Potawatomi | 2.2 /100 | #247 | Tragic 26.9% |
| Immigrants | Kazakhstan | 2.2 /100 | #248 | Tragic 26.9% |