Immigrants from Canada vs Austrian Unemployment
COMPARE
Immigrants from Canada
Austrian
Unemployment
Unemployment Comparison
Immigrants from Canada
Austrians
4.9%
UNEMPLOYMENT
98.8/ 100
METRIC RATING
65th/ 347
METRIC RANK
4.8%
UNEMPLOYMENT
99.5/ 100
METRIC RATING
44th/ 347
METRIC RANK
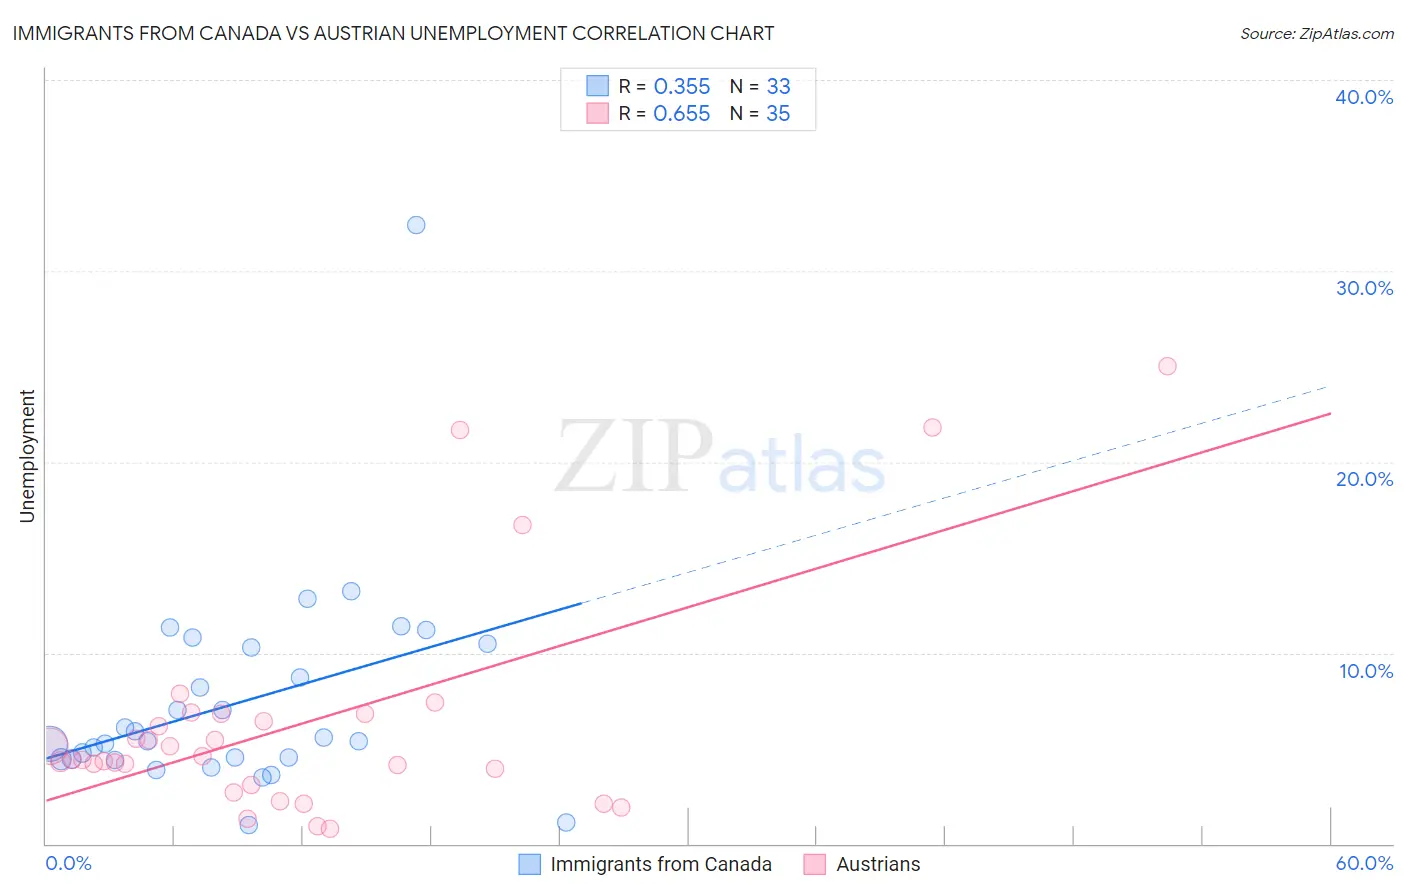
Immigrants from Canada vs Austrian Unemployment Correlation Chart
The statistical analysis conducted on geographies consisting of 458,510,369 people shows a mild positive correlation between the proportion of Immigrants from Canada and unemployment in the United States with a correlation coefficient (R) of 0.355 and weighted average of 4.9%. Similarly, the statistical analysis conducted on geographies consisting of 451,169,494 people shows a significant positive correlation between the proportion of Austrians and unemployment in the United States with a correlation coefficient (R) of 0.655 and weighted average of 4.8%, a difference of 1.4%.
Unemployment Correlation Summary
| Measurement | Immigrants from Canada | Austrian |
| Minimum | 1.0% | 0.80% |
| Maximum | 32.4% | 25.0% |
| Range | 31.4% | 24.2% |
| Mean | 7.4% | 6.3% |
| Median | 5.4% | 4.4% |
| Interquartile 25% (IQ1) | 4.4% | 3.1% |
| Interquartile 75% (IQ3) | 10.4% | 6.8% |
| Interquartile Range (IQR) | 5.9% | 3.7% |
| Standard Deviation (Sample) | 5.5% | 5.9% |
| Standard Deviation (Population) | 5.5% | 5.8% |
Similar Demographics by Unemployment
Demographics Similar to Immigrants from Canada by Unemployment
In terms of unemployment, the demographic groups most similar to Immigrants from Canada are Italian (4.9%, a difference of 0.14%), Slovak (4.9%, a difference of 0.15%), New Zealander (4.9%, a difference of 0.19%), Slavic (4.9%, a difference of 0.22%), and Immigrants from Bulgaria (4.9%, a difference of 0.23%).
| Demographics | Rating | Rank | Unemployment |
| Greeks | 99.0 /100 | #58 | Exceptional 4.9% |
| Bhutanese | 99.0 /100 | #59 | Exceptional 4.9% |
| Immigrants | Netherlands | 99.0 /100 | #60 | Exceptional 4.9% |
| Cambodians | 99.0 /100 | #61 | Exceptional 4.9% |
| Icelanders | 98.9 /100 | #62 | Exceptional 4.9% |
| Immigrants | Bulgaria | 98.9 /100 | #63 | Exceptional 4.9% |
| Italians | 98.9 /100 | #64 | Exceptional 4.9% |
| Immigrants | Canada | 98.8 /100 | #65 | Exceptional 4.9% |
| Slovaks | 98.7 /100 | #66 | Exceptional 4.9% |
| New Zealanders | 98.6 /100 | #67 | Exceptional 4.9% |
| Slavs | 98.6 /100 | #68 | Exceptional 4.9% |
| Immigrants | North America | 98.5 /100 | #69 | Exceptional 4.9% |
| Serbians | 98.4 /100 | #70 | Exceptional 4.9% |
| Immigrants | Japan | 98.3 /100 | #71 | Exceptional 4.9% |
| Burmese | 98.3 /100 | #72 | Exceptional 4.9% |
Demographics Similar to Austrians by Unemployment
In terms of unemployment, the demographic groups most similar to Austrians are French (4.8%, a difference of 0.050%), Yugoslavian (4.8%, a difference of 0.060%), Immigrants from Nepal (4.8%, a difference of 0.22%), Immigrants from Taiwan (4.8%, a difference of 0.24%), and Filipino (4.8%, a difference of 0.26%).
| Demographics | Rating | Rank | Unemployment |
| Czechoslovakians | 99.7 /100 | #37 | Exceptional 4.8% |
| Bolivians | 99.7 /100 | #38 | Exceptional 4.8% |
| Lithuanians | 99.7 /100 | #39 | Exceptional 4.8% |
| Northern Europeans | 99.7 /100 | #40 | Exceptional 4.8% |
| Immigrants | Bosnia and Herzegovina | 99.7 /100 | #41 | Exceptional 4.8% |
| Filipinos | 99.5 /100 | #42 | Exceptional 4.8% |
| Yugoslavians | 99.5 /100 | #43 | Exceptional 4.8% |
| Austrians | 99.5 /100 | #44 | Exceptional 4.8% |
| French | 99.5 /100 | #45 | Exceptional 4.8% |
| Immigrants | Nepal | 99.4 /100 | #46 | Exceptional 4.8% |
| Immigrants | Taiwan | 99.4 /100 | #47 | Exceptional 4.8% |
| Immigrants | Scotland | 99.3 /100 | #48 | Exceptional 4.9% |
| Immigrants | South Central Asia | 99.3 /100 | #49 | Exceptional 4.9% |
| French Canadians | 99.3 /100 | #50 | Exceptional 4.9% |
| Immigrants | Belgium | 99.2 /100 | #51 | Exceptional 4.9% |