Colville vs Immigrants from Russia No Vehicles in Household
COMPARE
Colville
Immigrants from Russia
No Vehicles in Household
No Vehicles in Household Comparison
Colville
Immigrants from Russia
13.7%
NO VEHICLES IN HOUSEHOLD
0.0/ 100
METRIC RATING
286th/ 347
METRIC RANK
15.1%
NO VEHICLES IN HOUSEHOLD
0.0/ 100
METRIC RATING
304th/ 347
METRIC RANK
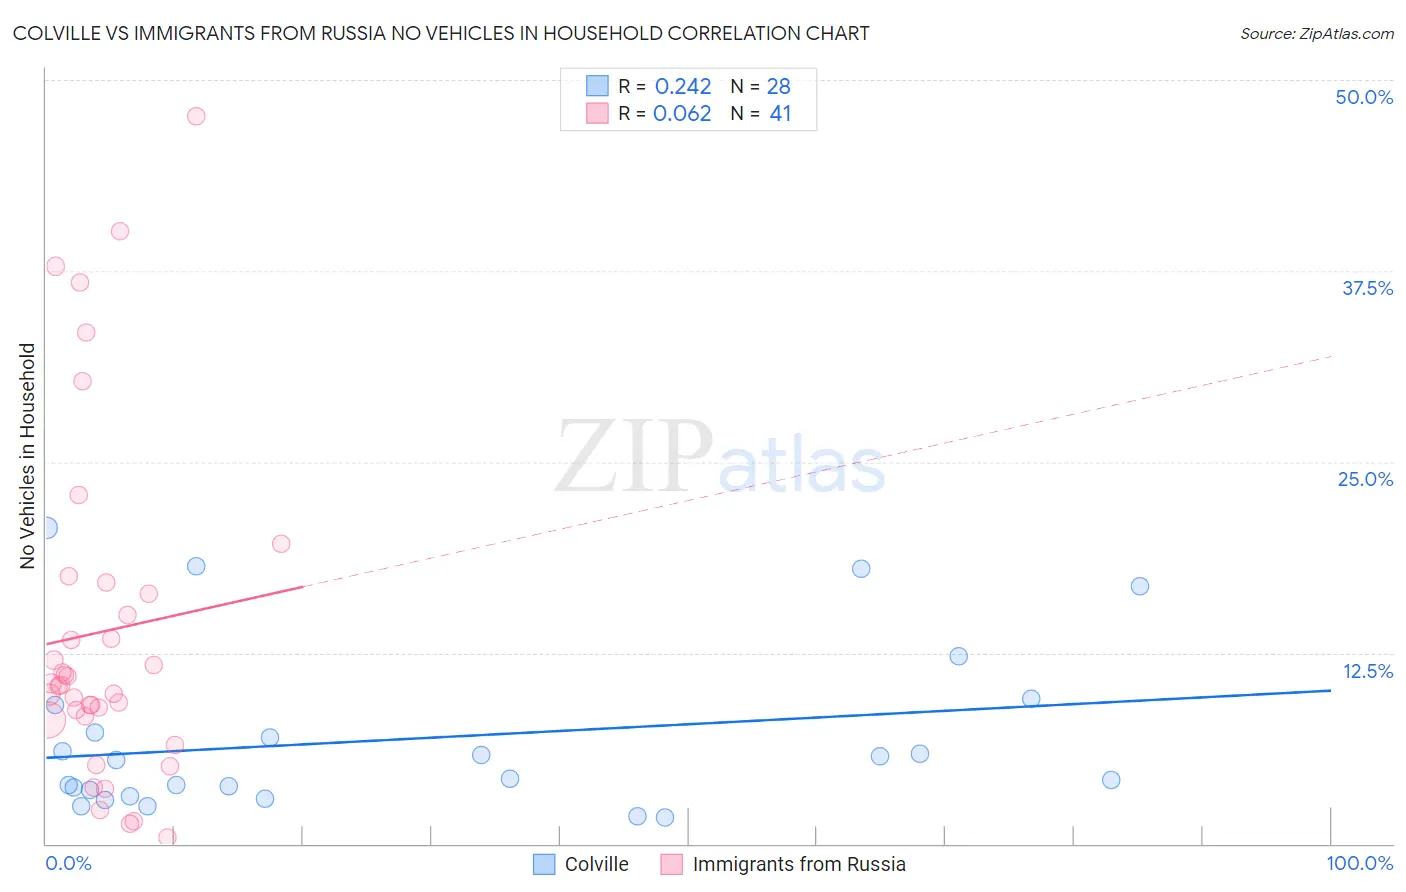
Colville vs Immigrants from Russia No Vehicles in Household Correlation Chart
The statistical analysis conducted on geographies consisting of 34,652,625 people shows a weak positive correlation between the proportion of Colville and percentage of households with no vehicle available in the United States with a correlation coefficient (R) of 0.242 and weighted average of 13.7%. Similarly, the statistical analysis conducted on geographies consisting of 347,176,226 people shows a slight positive correlation between the proportion of Immigrants from Russia and percentage of households with no vehicle available in the United States with a correlation coefficient (R) of 0.062 and weighted average of 15.1%, a difference of 10.3%.
No Vehicles in Household Correlation Summary
| Measurement | Colville | Immigrants from Russia |
| Minimum | 1.7% | 0.41% |
| Maximum | 20.7% | 47.6% |
| Range | 19.0% | 47.2% |
| Mean | 6.9% | 13.9% |
| Median | 4.9% | 10.4% |
| Interquartile 25% (IQ1) | 3.3% | 8.3% |
| Interquartile 75% (IQ3) | 8.2% | 16.7% |
| Interquartile Range (IQR) | 4.8% | 8.5% |
| Standard Deviation (Sample) | 5.4% | 11.3% |
| Standard Deviation (Population) | 5.3% | 11.1% |
Demographics Similar to Colville and Immigrants from Russia by No Vehicles in Household
In terms of no vehicles in household, the demographic groups most similar to Colville are Immigrants from Ireland (13.7%, a difference of 0.21%), Hopi (13.7%, a difference of 0.35%), Immigrants from Eastern Europe (13.6%, a difference of 0.66%), Immigrants from Australia (13.8%, a difference of 1.0%), and Indian (Asian) (14.1%, a difference of 2.8%). Similarly, the demographic groups most similar to Immigrants from Russia are Immigrants from China (15.2%, a difference of 0.38%), Immigrants from Western Africa (15.0%, a difference of 0.66%), Haitian (14.9%, a difference of 1.2%), Immigrants from Ukraine (14.9%, a difference of 1.7%), and Yuman (14.9%, a difference of 1.7%).
| Demographics | Rating | Rank | No Vehicles in Household |
| Immigrants | Eastern Europe | 0.0 /100 | #285 | Tragic 13.6% |
| Colville | 0.0 /100 | #286 | Tragic 13.7% |
| Immigrants | Ireland | 0.0 /100 | #287 | Tragic 13.7% |
| Hopi | 0.0 /100 | #288 | Tragic 13.7% |
| Immigrants | Australia | 0.0 /100 | #289 | Tragic 13.8% |
| Indians (Asian) | 0.0 /100 | #290 | Tragic 14.1% |
| Okinawans | 0.0 /100 | #291 | Tragic 14.1% |
| Pima | 0.0 /100 | #292 | Tragic 14.1% |
| Immigrants | Jamaica | 0.0 /100 | #293 | Tragic 14.2% |
| Belizeans | 0.0 /100 | #294 | Tragic 14.3% |
| Paraguayans | 0.0 /100 | #295 | Tragic 14.4% |
| Immigrants | Spain | 0.0 /100 | #296 | Tragic 14.5% |
| Immigrants | Panama | 0.0 /100 | #297 | Tragic 14.6% |
| Moroccans | 0.0 /100 | #298 | Tragic 14.7% |
| Immigrants | Greece | 0.0 /100 | #299 | Tragic 14.7% |
| Yuman | 0.0 /100 | #300 | Tragic 14.9% |
| Immigrants | Ukraine | 0.0 /100 | #301 | Tragic 14.9% |
| Haitians | 0.0 /100 | #302 | Tragic 14.9% |
| Immigrants | Western Africa | 0.0 /100 | #303 | Tragic 15.0% |
| Immigrants | Russia | 0.0 /100 | #304 | Tragic 15.1% |
| Immigrants | China | 0.0 /100 | #305 | Tragic 15.2% |