Bolivian vs Immigrants from Romania No Vehicles in Household
COMPARE
Bolivian
Immigrants from Romania
No Vehicles in Household
No Vehicles in Household Comparison
Bolivians
Immigrants from Romania
8.6%
NO VEHICLES IN HOUSEHOLD
99.4/ 100
METRIC RATING
80th/ 347
METRIC RANK
11.4%
NO VEHICLES IN HOUSEHOLD
5.3/ 100
METRIC RATING
228th/ 347
METRIC RANK
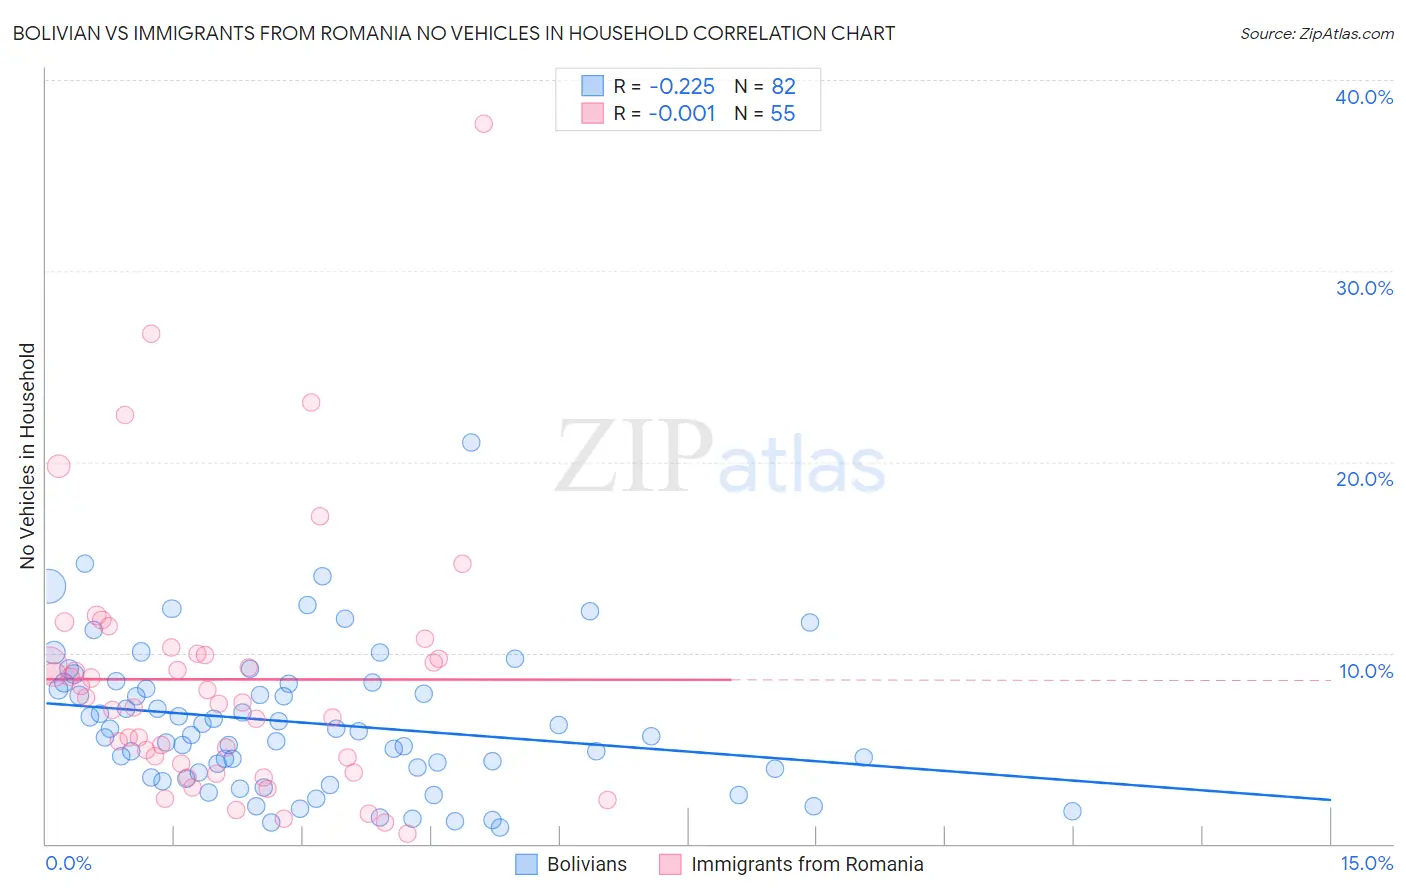
Bolivian vs Immigrants from Romania No Vehicles in Household Correlation Chart
The statistical analysis conducted on geographies consisting of 184,519,669 people shows a weak negative correlation between the proportion of Bolivians and percentage of households with no vehicle available in the United States with a correlation coefficient (R) of -0.225 and weighted average of 8.6%. Similarly, the statistical analysis conducted on geographies consisting of 256,713,633 people shows no correlation between the proportion of Immigrants from Romania and percentage of households with no vehicle available in the United States with a correlation coefficient (R) of -0.001 and weighted average of 11.4%, a difference of 33.0%.
No Vehicles in Household Correlation Summary
| Measurement | Bolivian | Immigrants from Romania |
| Minimum | 0.83% | 0.55% |
| Maximum | 21.0% | 37.7% |
| Range | 20.2% | 37.2% |
| Mean | 6.3% | 8.6% |
| Median | 5.8% | 7.4% |
| Interquartile 25% (IQ1) | 3.7% | 4.2% |
| Interquartile 75% (IQ3) | 8.4% | 9.9% |
| Interquartile Range (IQR) | 4.6% | 5.8% |
| Standard Deviation (Sample) | 3.7% | 6.8% |
| Standard Deviation (Population) | 3.7% | 6.8% |
Similar Demographics by No Vehicles in Household
Demographics Similar to Bolivians by No Vehicles in Household
In terms of no vehicles in household, the demographic groups most similar to Bolivians are Tsimshian (8.6%, a difference of 0.050%), Portuguese (8.6%, a difference of 0.15%), Immigrants from South Eastern Asia (8.6%, a difference of 0.18%), Immigrants from South Central Asia (8.6%, a difference of 0.20%), and Iranian (8.6%, a difference of 0.32%).
| Demographics | Rating | Rank | No Vehicles in Household |
| Poles | 99.6 /100 | #73 | Exceptional 8.4% |
| Cubans | 99.5 /100 | #74 | Exceptional 8.5% |
| Jordanians | 99.5 /100 | #75 | Exceptional 8.5% |
| Immigrants | Philippines | 99.5 /100 | #76 | Exceptional 8.5% |
| Iranians | 99.5 /100 | #77 | Exceptional 8.6% |
| Immigrants | South Central Asia | 99.5 /100 | #78 | Exceptional 8.6% |
| Portuguese | 99.5 /100 | #79 | Exceptional 8.6% |
| Bolivians | 99.4 /100 | #80 | Exceptional 8.6% |
| Tsimshian | 99.4 /100 | #81 | Exceptional 8.6% |
| Immigrants | South Eastern Asia | 99.4 /100 | #82 | Exceptional 8.6% |
| Italians | 99.4 /100 | #83 | Exceptional 8.6% |
| Immigrants | Jordan | 99.3 /100 | #84 | Exceptional 8.7% |
| Lebanese | 99.3 /100 | #85 | Exceptional 8.7% |
| Bangladeshis | 99.3 /100 | #86 | Exceptional 8.7% |
| Immigrants | England | 99.2 /100 | #87 | Exceptional 8.7% |
Demographics Similar to Immigrants from Romania by No Vehicles in Household
In terms of no vehicles in household, the demographic groups most similar to Immigrants from Romania are Immigrants from Pakistan (11.4%, a difference of 0.040%), Ugandan (11.4%, a difference of 0.040%), Immigrants from Somalia (11.4%, a difference of 0.060%), Immigrants from Norway (11.4%, a difference of 0.16%), and Immigrants from Japan (11.4%, a difference of 0.17%).
| Demographics | Rating | Rank | No Vehicles in Household |
| Peruvians | 8.4 /100 | #221 | Tragic 11.2% |
| Immigrants | South America | 8.0 /100 | #222 | Tragic 11.3% |
| Uruguayans | 7.7 /100 | #223 | Tragic 11.3% |
| Immigrants | Hong Kong | 7.2 /100 | #224 | Tragic 11.3% |
| Immigrants | Sierra Leone | 6.4 /100 | #225 | Tragic 11.3% |
| Immigrants | Somalia | 5.4 /100 | #226 | Tragic 11.4% |
| Immigrants | Pakistan | 5.4 /100 | #227 | Tragic 11.4% |
| Immigrants | Romania | 5.3 /100 | #228 | Tragic 11.4% |
| Ugandans | 5.3 /100 | #229 | Tragic 11.4% |
| Immigrants | Norway | 5.1 /100 | #230 | Tragic 11.4% |
| Immigrants | Japan | 5.1 /100 | #231 | Tragic 11.4% |
| Immigrants | Turkey | 4.8 /100 | #232 | Tragic 11.5% |
| Houma | 4.7 /100 | #233 | Tragic 11.5% |
| Immigrants | Peru | 4.5 /100 | #234 | Tragic 11.5% |
| Kiowa | 4.0 /100 | #235 | Tragic 11.5% |