Immigrants from Bangladesh vs Korean 11th Grade
COMPARE
Immigrants from Bangladesh
Korean
11th Grade
11th Grade Comparison
Immigrants from Bangladesh
Koreans
89.5%
11TH GRADE
0.0/ 100
METRIC RATING
309th/ 347
METRIC RANK
92.1%
11TH GRADE
14.4/ 100
METRIC RATING
212th/ 347
METRIC RANK
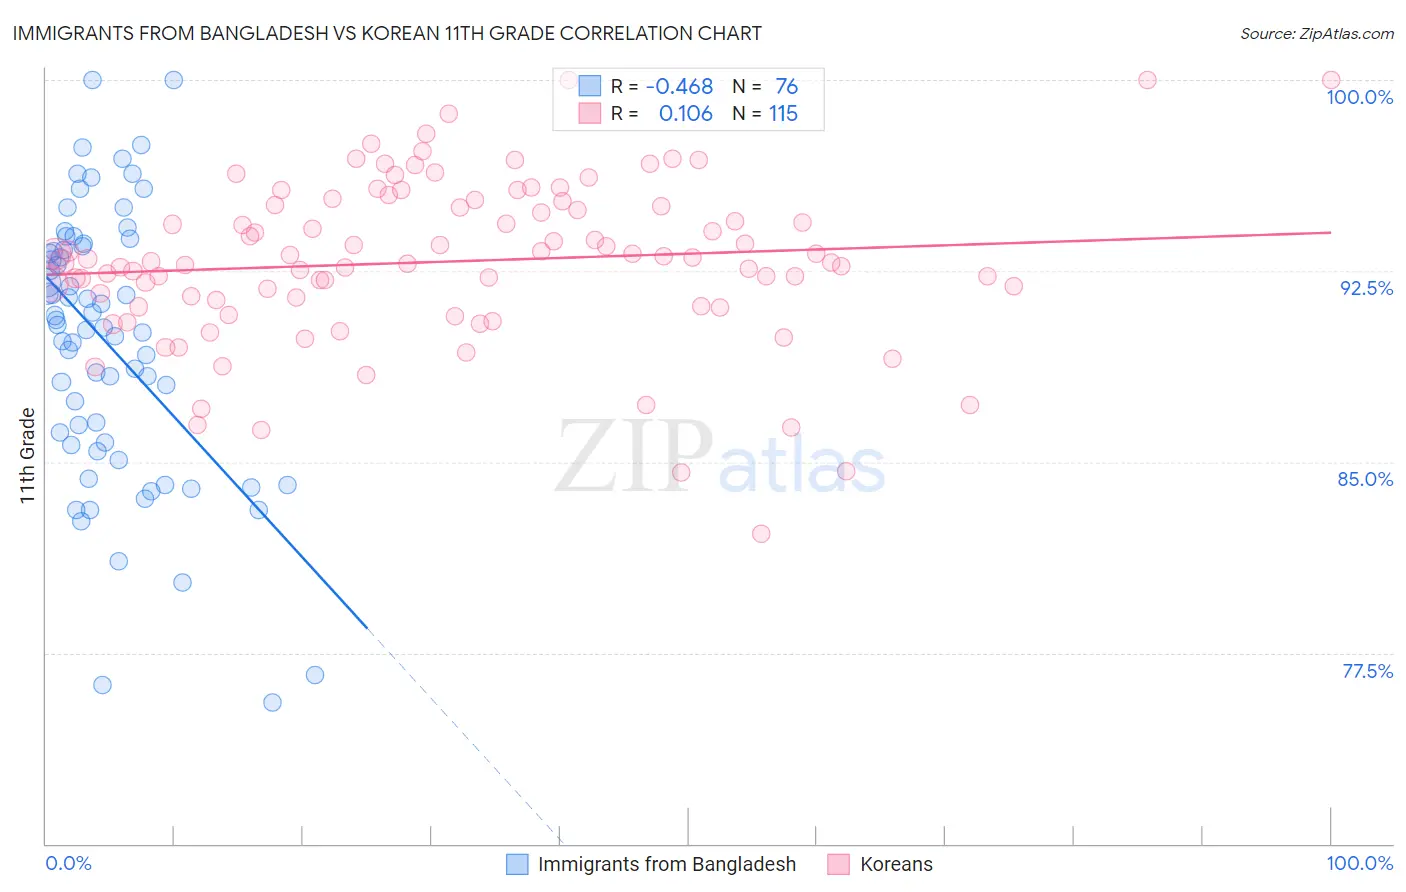
Immigrants from Bangladesh vs Korean 11th Grade Correlation Chart
The statistical analysis conducted on geographies consisting of 203,672,706 people shows a moderate negative correlation between the proportion of Immigrants from Bangladesh and percentage of population with at least 11th grade education in the United States with a correlation coefficient (R) of -0.468 and weighted average of 89.5%. Similarly, the statistical analysis conducted on geographies consisting of 510,943,943 people shows a poor positive correlation between the proportion of Koreans and percentage of population with at least 11th grade education in the United States with a correlation coefficient (R) of 0.106 and weighted average of 92.1%, a difference of 2.9%.
11th Grade Correlation Summary
| Measurement | Immigrants from Bangladesh | Korean |
| Minimum | 75.6% | 82.2% |
| Maximum | 100.0% | 100.0% |
| Range | 24.4% | 17.8% |
| Mean | 89.6% | 92.9% |
| Median | 90.3% | 92.9% |
| Interquartile 25% (IQ1) | 85.7% | 91.1% |
| Interquartile 75% (IQ3) | 93.4% | 95.1% |
| Interquartile Range (IQR) | 7.7% | 3.9% |
| Standard Deviation (Sample) | 5.3% | 3.2% |
| Standard Deviation (Population) | 5.3% | 3.2% |
Similar Demographics by 11th Grade
Demographics Similar to Immigrants from Bangladesh by 11th Grade
In terms of 11th grade, the demographic groups most similar to Immigrants from Bangladesh are Yaqui (89.5%, a difference of 0.010%), Nepalese (89.5%, a difference of 0.020%), Immigrants from Dominica (89.5%, a difference of 0.040%), Vietnamese (89.4%, a difference of 0.080%), and Ecuadorian (89.6%, a difference of 0.10%).
| Demographics | Rating | Rank | 11th Grade |
| Immigrants | Guyana | 0.0 /100 | #302 | Tragic 89.7% |
| Immigrants | Immigrants | 0.0 /100 | #303 | Tragic 89.7% |
| Yuman | 0.0 /100 | #304 | Tragic 89.7% |
| Immigrants | Cambodia | 0.0 /100 | #305 | Tragic 89.6% |
| Ecuadorians | 0.0 /100 | #306 | Tragic 89.6% |
| Immigrants | Dominica | 0.0 /100 | #307 | Tragic 89.5% |
| Nepalese | 0.0 /100 | #308 | Tragic 89.5% |
| Immigrants | Bangladesh | 0.0 /100 | #309 | Tragic 89.5% |
| Yaqui | 0.0 /100 | #310 | Tragic 89.5% |
| Vietnamese | 0.0 /100 | #311 | Tragic 89.4% |
| Immigrants | Portugal | 0.0 /100 | #312 | Tragic 89.3% |
| Immigrants | Caribbean | 0.0 /100 | #313 | Tragic 89.1% |
| Cape Verdeans | 0.0 /100 | #314 | Tragic 89.1% |
| Immigrants | Ecuador | 0.0 /100 | #315 | Tragic 89.1% |
| Immigrants | Cuba | 0.0 /100 | #316 | Tragic 88.9% |
Demographics Similar to Koreans by 11th Grade
In terms of 11th grade, the demographic groups most similar to Koreans are Immigrants from Ethiopia (92.1%, a difference of 0.010%), Afghan (92.1%, a difference of 0.030%), Immigrants from Southern Europe (92.1%, a difference of 0.040%), Immigrants from Micronesia (92.2%, a difference of 0.060%), and Somali (92.1%, a difference of 0.060%).
| Demographics | Rating | Rank | 11th Grade |
| Kiowa | 23.2 /100 | #205 | Fair 92.2% |
| Bolivians | 23.2 /100 | #206 | Fair 92.2% |
| Immigrants | Oceania | 22.4 /100 | #207 | Fair 92.2% |
| Colville | 21.8 /100 | #208 | Fair 92.2% |
| Tongans | 19.8 /100 | #209 | Poor 92.2% |
| Ethiopians | 18.8 /100 | #210 | Poor 92.2% |
| Immigrants | Micronesia | 17.7 /100 | #211 | Poor 92.2% |
| Koreans | 14.4 /100 | #212 | Poor 92.1% |
| Immigrants | Ethiopia | 13.9 /100 | #213 | Poor 92.1% |
| Afghans | 12.8 /100 | #214 | Poor 92.1% |
| Immigrants | Southern Europe | 12.5 /100 | #215 | Poor 92.1% |
| Somalis | 11.6 /100 | #216 | Poor 92.1% |
| Immigrants | Sierra Leone | 11.1 /100 | #217 | Poor 92.0% |
| Blackfeet | 10.1 /100 | #218 | Poor 92.0% |
| Portuguese | 10.0 /100 | #219 | Tragic 92.0% |