Immigrants from Bahamas vs Serbian 4th Grade
COMPARE
Immigrants from Bahamas
Serbian
4th Grade
4th Grade Comparison
Immigrants from Bahamas
Serbians
97.3%
4TH GRADE
10.8/ 100
METRIC RATING
208th/ 347
METRIC RANK
98.1%
4TH GRADE
99.7/ 100
METRIC RATING
62nd/ 347
METRIC RANK
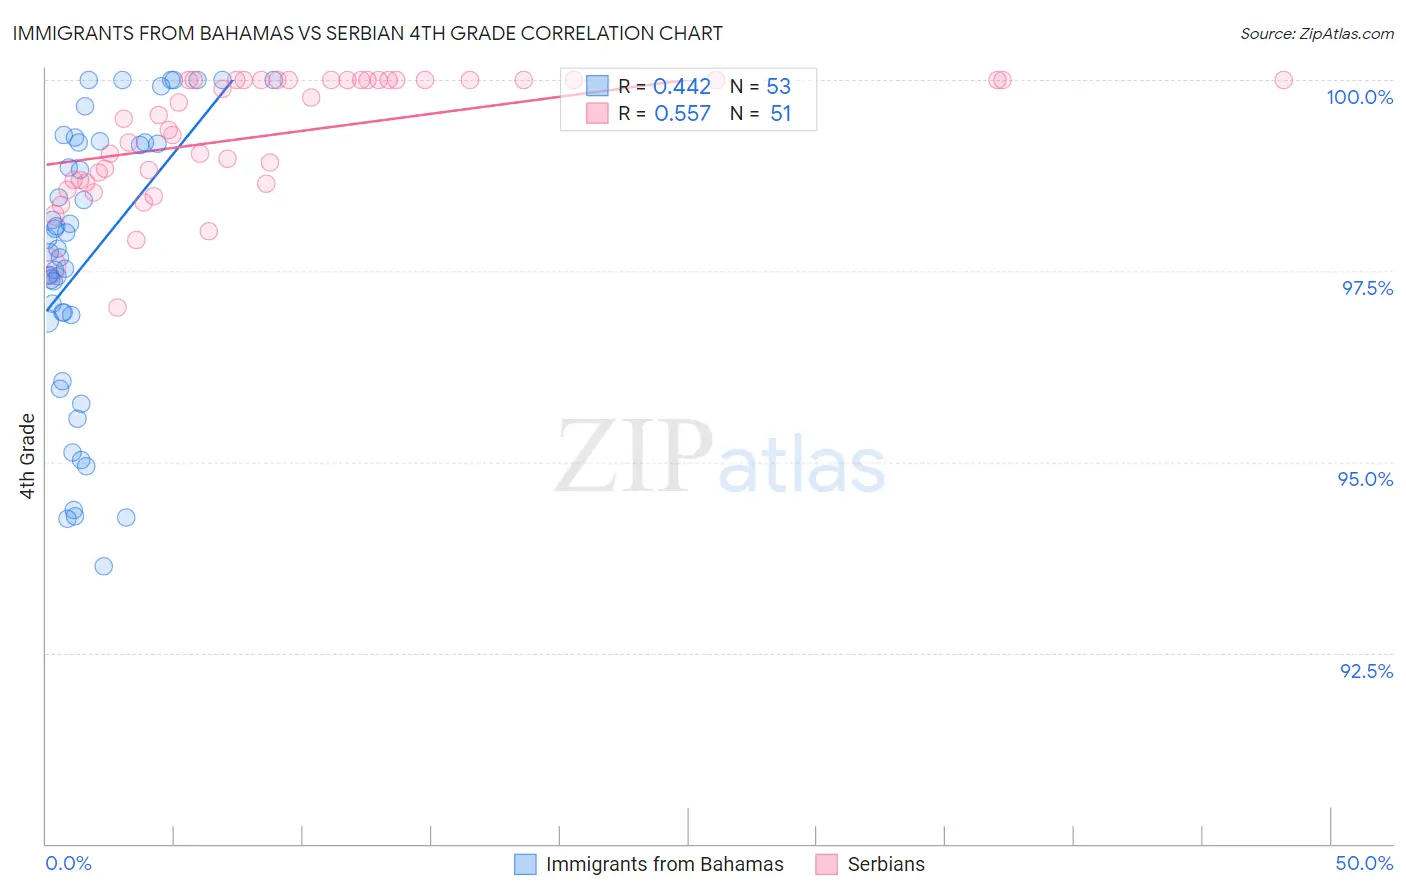
Immigrants from Bahamas vs Serbian 4th Grade Correlation Chart
The statistical analysis conducted on geographies consisting of 104,665,087 people shows a moderate positive correlation between the proportion of Immigrants from Bahamas and percentage of population with at least 4th grade education in the United States with a correlation coefficient (R) of 0.442 and weighted average of 97.3%. Similarly, the statistical analysis conducted on geographies consisting of 267,642,942 people shows a substantial positive correlation between the proportion of Serbians and percentage of population with at least 4th grade education in the United States with a correlation coefficient (R) of 0.557 and weighted average of 98.1%, a difference of 0.75%.
4th Grade Correlation Summary
| Measurement | Immigrants from Bahamas | Serbian |
| Minimum | 93.6% | 97.0% |
| Maximum | 100.0% | 100.0% |
| Range | 6.4% | 3.0% |
| Mean | 97.7% | 99.3% |
| Median | 97.8% | 99.5% |
| Interquartile 25% (IQ1) | 96.9% | 98.7% |
| Interquartile 75% (IQ3) | 99.2% | 100.0% |
| Interquartile Range (IQR) | 2.3% | 1.3% |
| Standard Deviation (Sample) | 1.8% | 0.78% |
| Standard Deviation (Population) | 1.8% | 0.78% |
Similar Demographics by 4th Grade
Demographics Similar to Immigrants from Bahamas by 4th Grade
In terms of 4th grade, the demographic groups most similar to Immigrants from Bahamas are Moroccan (97.3%, a difference of 0.010%), Paiute (97.3%, a difference of 0.020%), Immigrants from Zaire (97.3%, a difference of 0.020%), Laotian (97.3%, a difference of 0.020%), and Immigrants from Oceania (97.3%, a difference of 0.020%).
| Demographics | Rating | Rank | 4th Grade |
| Immigrants | Southern Europe | 16.2 /100 | #201 | Poor 97.4% |
| Immigrants | Chile | 16.1 /100 | #202 | Poor 97.4% |
| Immigrants | Northern Africa | 15.1 /100 | #203 | Poor 97.4% |
| Africans | 14.6 /100 | #204 | Poor 97.4% |
| Paiute | 13.2 /100 | #205 | Poor 97.3% |
| Immigrants | Zaire | 12.8 /100 | #206 | Poor 97.3% |
| Moroccans | 11.3 /100 | #207 | Poor 97.3% |
| Immigrants | Bahamas | 10.8 /100 | #208 | Poor 97.3% |
| Laotians | 9.3 /100 | #209 | Tragic 97.3% |
| Immigrants | Oceania | 9.1 /100 | #210 | Tragic 97.3% |
| Sudanese | 9.0 /100 | #211 | Tragic 97.3% |
| Tohono O'odham | 8.4 /100 | #212 | Tragic 97.3% |
| Costa Ricans | 8.3 /100 | #213 | Tragic 97.3% |
| Immigrants | Nepal | 7.7 /100 | #214 | Tragic 97.3% |
| Immigrants | Morocco | 7.1 /100 | #215 | Tragic 97.3% |
Demographics Similar to Serbians by 4th Grade
In terms of 4th grade, the demographic groups most similar to Serbians are Immigrants from North America (98.1%, a difference of 0.0%), Immigrants from Canada (98.1%, a difference of 0.010%), Russian (98.0%, a difference of 0.010%), Cajun (98.0%, a difference of 0.010%), and American (98.1%, a difference of 0.020%).
| Demographics | Rating | Rank | 4th Grade |
| Whites/Caucasians | 99.8 /100 | #55 | Exceptional 98.1% |
| Greeks | 99.8 /100 | #56 | Exceptional 98.1% |
| Austrians | 99.8 /100 | #57 | Exceptional 98.1% |
| Creek | 99.8 /100 | #58 | Exceptional 98.1% |
| Americans | 99.8 /100 | #59 | Exceptional 98.1% |
| Immigrants | Canada | 99.7 /100 | #60 | Exceptional 98.1% |
| Immigrants | North America | 99.7 /100 | #61 | Exceptional 98.1% |
| Serbians | 99.7 /100 | #62 | Exceptional 98.1% |
| Russians | 99.7 /100 | #63 | Exceptional 98.0% |
| Cajuns | 99.7 /100 | #64 | Exceptional 98.0% |
| Immigrants | Northern Europe | 99.6 /100 | #65 | Exceptional 98.0% |
| Canadians | 99.6 /100 | #66 | Exceptional 98.0% |
| New Zealanders | 99.6 /100 | #67 | Exceptional 98.0% |
| Kiowa | 99.6 /100 | #68 | Exceptional 98.0% |
| Pueblo | 99.6 /100 | #69 | Exceptional 98.0% |