Thai vs Immigrants from Barbados 2 or more Vehicles in Household
COMPARE
Thai
Immigrants from Barbados
2 or more Vehicles in Household
2 or more Vehicles in Household Comparison
Thais
Immigrants from Barbados
57.9%
2 OR MORE VEHICLES IN HOUSEHOLD
99.1/ 100
METRIC RATING
87th/ 347
METRIC RANK
35.8%
2 OR MORE VEHICLES IN HOUSEHOLD
0.0/ 100
METRIC RATING
339th/ 347
METRIC RANK
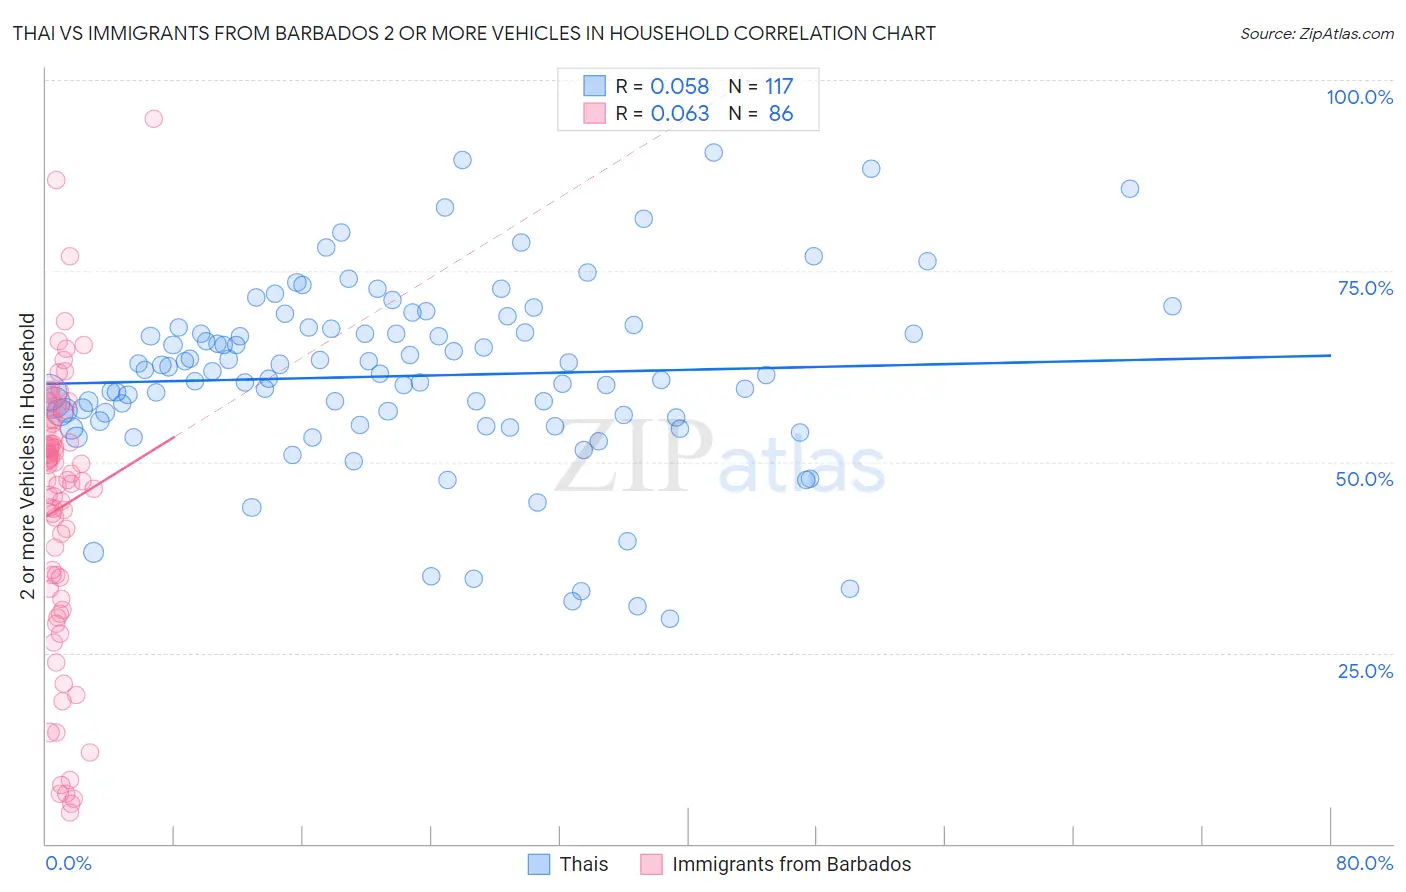
Thai vs Immigrants from Barbados 2 or more Vehicles in Household Correlation Chart
The statistical analysis conducted on geographies consisting of 475,419,380 people shows a slight positive correlation between the proportion of Thais and percentage of households with 2 or more vehicles available in the United States with a correlation coefficient (R) of 0.058 and weighted average of 57.9%. Similarly, the statistical analysis conducted on geographies consisting of 112,774,153 people shows a slight positive correlation between the proportion of Immigrants from Barbados and percentage of households with 2 or more vehicles available in the United States with a correlation coefficient (R) of 0.063 and weighted average of 35.8%, a difference of 61.9%.
2 or more Vehicles in Household Correlation Summary
| Measurement | Thai | Immigrants from Barbados |
| Minimum | 29.5% | 4.2% |
| Maximum | 90.5% | 94.9% |
| Range | 61.0% | 90.7% |
| Mean | 61.2% | 44.0% |
| Median | 61.6% | 48.0% |
| Interquartile 25% (IQ1) | 55.6% | 33.4% |
| Interquartile 75% (IQ3) | 67.5% | 55.1% |
| Interquartile Range (IQR) | 11.9% | 21.6% |
| Standard Deviation (Sample) | 12.0% | 18.4% |
| Standard Deviation (Population) | 11.9% | 18.3% |
Similar Demographics by 2 or more Vehicles in Household
Demographics Similar to Thais by 2 or more Vehicles in Household
In terms of 2 or more vehicles in household, the demographic groups most similar to Thais are Immigrants from Iran (57.9%, a difference of 0.010%), Potawatomi (58.0%, a difference of 0.040%), Slovak (58.0%, a difference of 0.070%), Immigrants from Germany (57.9%, a difference of 0.080%), and Hispanic or Latino (57.9%, a difference of 0.080%).
| Demographics | Rating | Rank | 2 or more Vehicles in Household |
| Immigrants | England | 99.3 /100 | #80 | Exceptional 58.1% |
| Immigrants | Iraq | 99.3 /100 | #81 | Exceptional 58.1% |
| Iranians | 99.3 /100 | #82 | Exceptional 58.1% |
| Icelanders | 99.2 /100 | #83 | Exceptional 58.0% |
| Maltese | 99.2 /100 | #84 | Exceptional 58.0% |
| Slovaks | 99.2 /100 | #85 | Exceptional 58.0% |
| Potawatomi | 99.1 /100 | #86 | Exceptional 58.0% |
| Thais | 99.1 /100 | #87 | Exceptional 57.9% |
| Immigrants | Iran | 99.1 /100 | #88 | Exceptional 57.9% |
| Immigrants | Germany | 99.0 /100 | #89 | Exceptional 57.9% |
| Hispanics or Latinos | 99.0 /100 | #90 | Exceptional 57.9% |
| Pakistanis | 99.0 /100 | #91 | Exceptional 57.9% |
| Shoshone | 99.0 /100 | #92 | Exceptional 57.9% |
| Ottawa | 99.0 /100 | #93 | Exceptional 57.9% |
| Filipinos | 98.9 /100 | #94 | Exceptional 57.8% |
Demographics Similar to Immigrants from Barbados by 2 or more Vehicles in Household
In terms of 2 or more vehicles in household, the demographic groups most similar to Immigrants from Barbados are British West Indian (35.4%, a difference of 1.1%), Guyanese (35.4%, a difference of 1.1%), Dominican (35.3%, a difference of 1.3%), Immigrants from Guyana (35.0%, a difference of 2.2%), and Yup'ik (34.9%, a difference of 2.4%).
| Demographics | Rating | Rank | 2 or more Vehicles in Household |
| Trinidadians and Tobagonians | 0.0 /100 | #332 | Tragic 40.9% |
| Immigrants | Ecuador | 0.0 /100 | #333 | Tragic 40.5% |
| Immigrants | Trinidad and Tobago | 0.0 /100 | #334 | Tragic 40.3% |
| Immigrants | Bangladesh | 0.0 /100 | #335 | Tragic 38.8% |
| Vietnamese | 0.0 /100 | #336 | Tragic 38.5% |
| Barbadians | 0.0 /100 | #337 | Tragic 38.3% |
| Immigrants | Uzbekistan | 0.0 /100 | #338 | Tragic 37.9% |
| Immigrants | Barbados | 0.0 /100 | #339 | Tragic 35.8% |
| British West Indians | 0.0 /100 | #340 | Tragic 35.4% |
| Guyanese | 0.0 /100 | #341 | Tragic 35.4% |
| Dominicans | 0.0 /100 | #342 | Tragic 35.3% |
| Immigrants | Guyana | 0.0 /100 | #343 | Tragic 35.0% |
| Yup'ik | 0.0 /100 | #344 | Tragic 34.9% |
| Immigrants | Dominican Republic | 0.0 /100 | #345 | Tragic 33.2% |
| Immigrants | St. Vincent and the Grenadines | 0.0 /100 | #346 | Tragic 31.0% |