Immigrants from Austria vs Inupiat 9th Grade
COMPARE
Immigrants from Austria
Inupiat
9th Grade
9th Grade Comparison
Immigrants from Austria
Inupiat
96.0%
9TH GRADE
99.8/ 100
METRIC RATING
55th/ 347
METRIC RANK
95.8%
9TH GRADE
99.5/ 100
METRIC RATING
75th/ 347
METRIC RANK
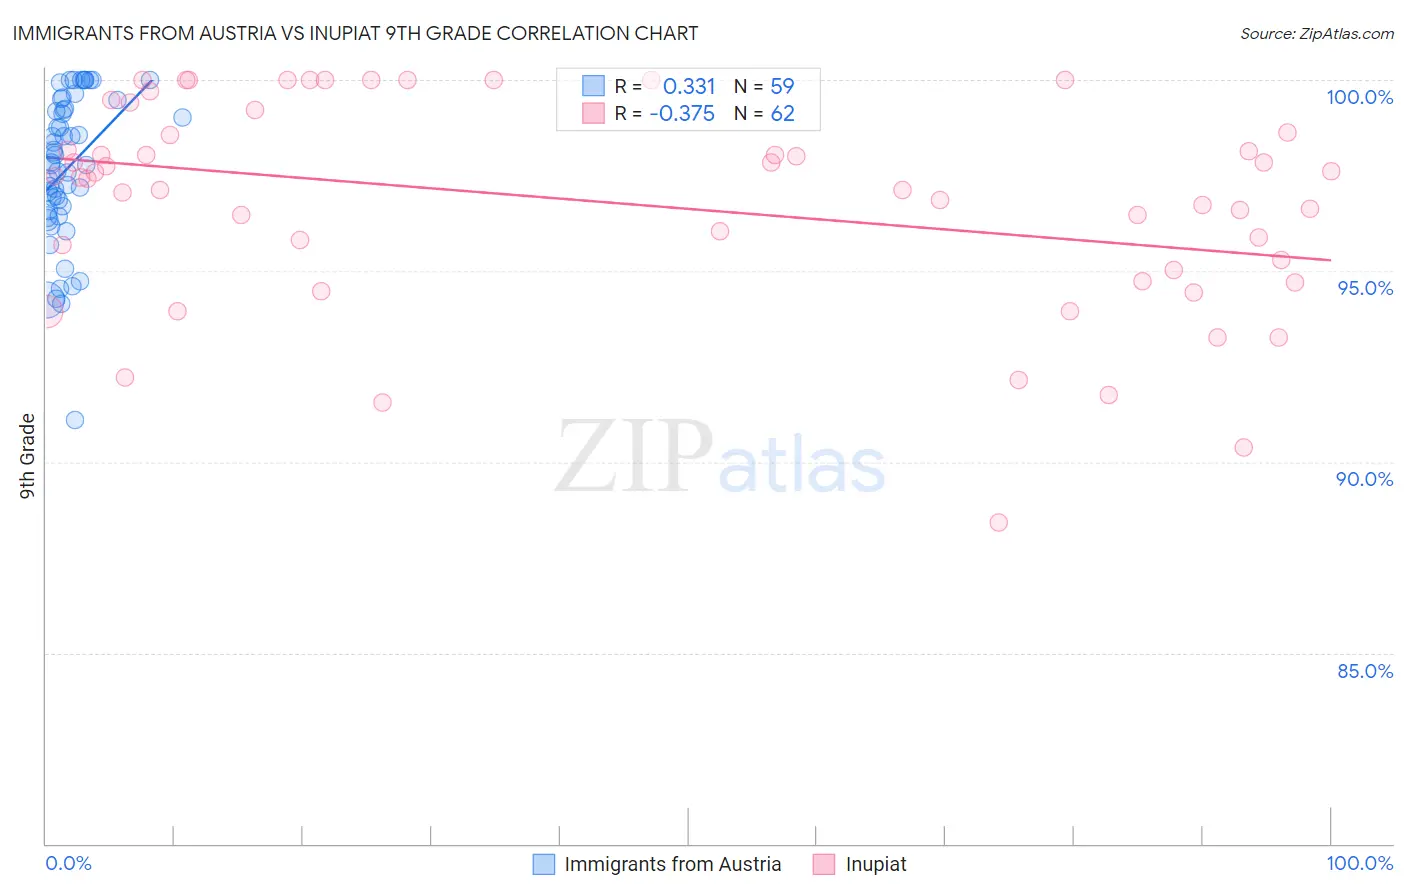
Immigrants from Austria vs Inupiat 9th Grade Correlation Chart
The statistical analysis conducted on geographies consisting of 167,973,751 people shows a mild positive correlation between the proportion of Immigrants from Austria and percentage of population with at least 9th grade education in the United States with a correlation coefficient (R) of 0.331 and weighted average of 96.0%. Similarly, the statistical analysis conducted on geographies consisting of 96,349,180 people shows a mild negative correlation between the proportion of Inupiat and percentage of population with at least 9th grade education in the United States with a correlation coefficient (R) of -0.375 and weighted average of 95.8%, a difference of 0.20%.
9th Grade Correlation Summary
| Measurement | Immigrants from Austria | Inupiat |
| Minimum | 91.1% | 88.4% |
| Maximum | 100.0% | 100.0% |
| Range | 8.9% | 11.6% |
| Mean | 97.7% | 96.8% |
| Median | 97.8% | 97.4% |
| Interquartile 25% (IQ1) | 96.6% | 95.0% |
| Interquartile 75% (IQ3) | 99.2% | 98.6% |
| Interquartile Range (IQR) | 2.7% | 3.6% |
| Standard Deviation (Sample) | 1.9% | 2.7% |
| Standard Deviation (Population) | 1.9% | 2.7% |
Demographics Similar to Immigrants from Austria and Inupiat by 9th Grade
In terms of 9th grade, the demographic groups most similar to Immigrants from Austria are Immigrants from North America (96.0%, a difference of 0.0%), Macedonian (96.0%, a difference of 0.010%), Aleut (96.0%, a difference of 0.010%), New Zealander (95.9%, a difference of 0.030%), and Native Hawaiian (95.9%, a difference of 0.050%). Similarly, the demographic groups most similar to Inupiat are Thai (95.8%, a difference of 0.010%), Immigrants from Belgium (95.8%, a difference of 0.020%), Turkish (95.8%, a difference of 0.020%), Immigrants from Singapore (95.8%, a difference of 0.020%), and Immigrants from Australia (95.8%, a difference of 0.030%).
| Demographics | Rating | Rank | 9th Grade |
| Immigrants | Austria | 99.8 /100 | #55 | Exceptional 96.0% |
| Immigrants | North America | 99.8 /100 | #56 | Exceptional 96.0% |
| Macedonians | 99.8 /100 | #57 | Exceptional 96.0% |
| Aleuts | 99.8 /100 | #58 | Exceptional 96.0% |
| New Zealanders | 99.8 /100 | #59 | Exceptional 95.9% |
| Native Hawaiians | 99.8 /100 | #60 | Exceptional 95.9% |
| Sioux | 99.8 /100 | #61 | Exceptional 95.9% |
| Ukrainians | 99.7 /100 | #62 | Exceptional 95.9% |
| Canadians | 99.7 /100 | #63 | Exceptional 95.9% |
| Zimbabweans | 99.7 /100 | #64 | Exceptional 95.9% |
| Immigrants | England | 99.6 /100 | #65 | Exceptional 95.9% |
| Immigrants | Netherlands | 99.6 /100 | #66 | Exceptional 95.8% |
| Cypriots | 99.6 /100 | #67 | Exceptional 95.8% |
| Immigrants | Ireland | 99.6 /100 | #68 | Exceptional 95.8% |
| Immigrants | Lithuania | 99.6 /100 | #69 | Exceptional 95.8% |
| Immigrants | Australia | 99.5 /100 | #70 | Exceptional 95.8% |
| Immigrants | Belgium | 99.5 /100 | #71 | Exceptional 95.8% |
| Turks | 99.5 /100 | #72 | Exceptional 95.8% |
| Immigrants | Singapore | 99.5 /100 | #73 | Exceptional 95.8% |
| Thais | 99.5 /100 | #74 | Exceptional 95.8% |
| Inupiat | 99.5 /100 | #75 | Exceptional 95.8% |