Nicaraguan vs Iraqi No Vehicles in Household
COMPARE
Nicaraguan
Iraqi
No Vehicles in Household
No Vehicles in Household Comparison
Nicaraguans
Iraqis
9.7%
NO VEHICLES IN HOUSEHOLD
89.5/ 100
METRIC RATING
129th/ 347
METRIC RANK
7.7%
NO VEHICLES IN HOUSEHOLD
99.9/ 100
METRIC RATING
36th/ 347
METRIC RANK
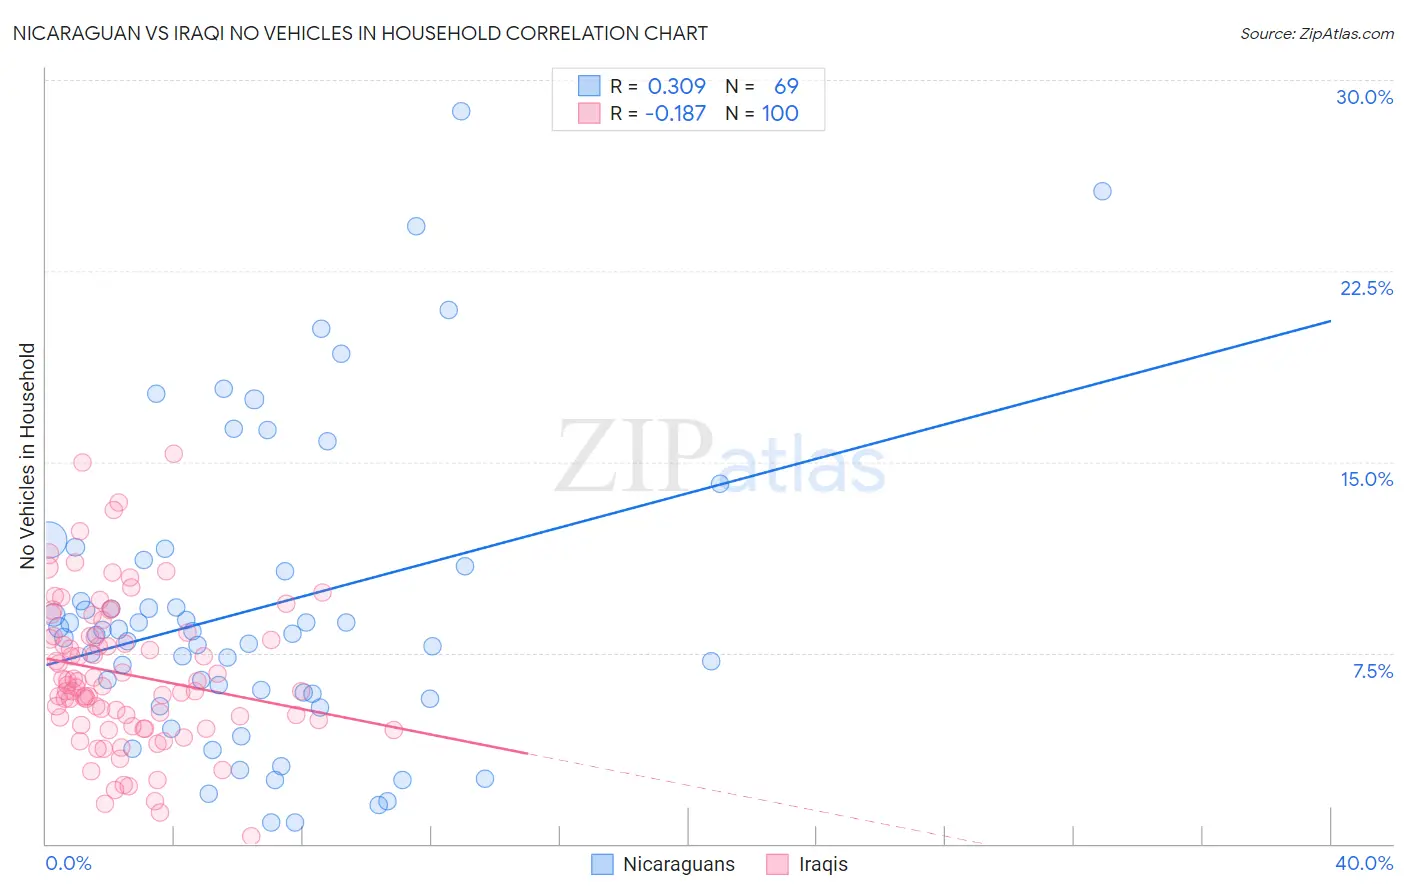
Nicaraguan vs Iraqi No Vehicles in Household Correlation Chart
The statistical analysis conducted on geographies consisting of 285,349,365 people shows a mild positive correlation between the proportion of Nicaraguans and percentage of households with no vehicle available in the United States with a correlation coefficient (R) of 0.309 and weighted average of 9.7%. Similarly, the statistical analysis conducted on geographies consisting of 116,437,877 people shows a poor negative correlation between the proportion of Iraqis and percentage of households with no vehicle available in the United States with a correlation coefficient (R) of -0.187 and weighted average of 7.7%, a difference of 24.6%.
No Vehicles in Household Correlation Summary
| Measurement | Nicaraguan | Iraqi |
| Minimum | 0.83% | 0.29% |
| Maximum | 28.8% | 15.3% |
| Range | 27.9% | 15.0% |
| Mean | 9.2% | 6.7% |
| Median | 8.2% | 6.2% |
| Interquartile 25% (IQ1) | 5.8% | 4.8% |
| Interquartile 75% (IQ3) | 11.0% | 8.2% |
| Interquartile Range (IQR) | 5.2% | 3.4% |
| Standard Deviation (Sample) | 6.0% | 2.9% |
| Standard Deviation (Population) | 5.9% | 2.9% |
Similar Demographics by No Vehicles in Household
Demographics Similar to Nicaraguans by No Vehicles in Household
In terms of no vehicles in household, the demographic groups most similar to Nicaraguans are Immigrants from Syria (9.6%, a difference of 0.030%), Immigrants from Kenya (9.6%, a difference of 0.11%), Burmese (9.7%, a difference of 0.25%), Icelander (9.6%, a difference of 0.29%), and Immigrants from Cameroon (9.6%, a difference of 0.46%).
| Demographics | Rating | Rank | No Vehicles in Household |
| Costa Ricans | 92.3 /100 | #122 | Exceptional 9.5% |
| Blackfeet | 91.4 /100 | #123 | Exceptional 9.6% |
| Immigrants | Korea | 90.9 /100 | #124 | Exceptional 9.6% |
| Immigrants | Cameroon | 90.6 /100 | #125 | Exceptional 9.6% |
| Icelanders | 90.2 /100 | #126 | Exceptional 9.6% |
| Immigrants | Kenya | 89.7 /100 | #127 | Excellent 9.6% |
| Immigrants | Syria | 89.5 /100 | #128 | Excellent 9.6% |
| Nicaraguans | 89.5 /100 | #129 | Excellent 9.7% |
| Burmese | 88.8 /100 | #130 | Excellent 9.7% |
| Immigrants | Azores | 88.2 /100 | #131 | Excellent 9.7% |
| Kenyans | 88.0 /100 | #132 | Excellent 9.7% |
| Immigrants | Oceania | 87.1 /100 | #133 | Excellent 9.7% |
| Syrians | 87.1 /100 | #134 | Excellent 9.7% |
| Latvians | 85.1 /100 | #135 | Excellent 9.8% |
| Immigrants | South Africa | 85.0 /100 | #136 | Excellent 9.8% |
Demographics Similar to Iraqis by No Vehicles in Household
In terms of no vehicles in household, the demographic groups most similar to Iraqis are Cherokee (7.7%, a difference of 0.13%), Basque (7.8%, a difference of 0.25%), Immigrants from Vietnam (7.7%, a difference of 0.28%), Creek (7.8%, a difference of 0.39%), and Immigrants from Taiwan (7.7%, a difference of 0.41%).
| Demographics | Rating | Rank | No Vehicles in Household |
| Americans | 100.0 /100 | #29 | Exceptional 7.7% |
| Finns | 100.0 /100 | #30 | Exceptional 7.7% |
| Native Hawaiians | 100.0 /100 | #31 | Exceptional 7.7% |
| Malaysians | 100.0 /100 | #32 | Exceptional 7.7% |
| Immigrants | Taiwan | 100.0 /100 | #33 | Exceptional 7.7% |
| Immigrants | Vietnam | 100.0 /100 | #34 | Exceptional 7.7% |
| Cherokee | 99.9 /100 | #35 | Exceptional 7.7% |
| Iraqis | 99.9 /100 | #36 | Exceptional 7.7% |
| Basques | 99.9 /100 | #37 | Exceptional 7.8% |
| Creek | 99.9 /100 | #38 | Exceptional 7.8% |
| Immigrants | Fiji | 99.9 /100 | #39 | Exceptional 7.8% |
| Czechoslovakians | 99.9 /100 | #40 | Exceptional 7.8% |
| French Canadians | 99.9 /100 | #41 | Exceptional 7.8% |
| Swiss | 99.9 /100 | #42 | Exceptional 7.9% |
| Chickasaw | 99.9 /100 | #43 | Exceptional 7.9% |