Hmong vs Hawaiian 4 or more Vehicles in Household
COMPARE
Hmong
Hawaiian
4 or more Vehicles in Household
4 or more Vehicles in Household Comparison
Hmong
Hawaiians
7.0%
4 OR MORE VEHICLES IN HOUSEHOLD
98.3/ 100
METRIC RATING
104th/ 347
METRIC RANK
8.9%
4 OR MORE VEHICLES IN HOUSEHOLD
100.0/ 100
METRIC RATING
13th/ 347
METRIC RANK
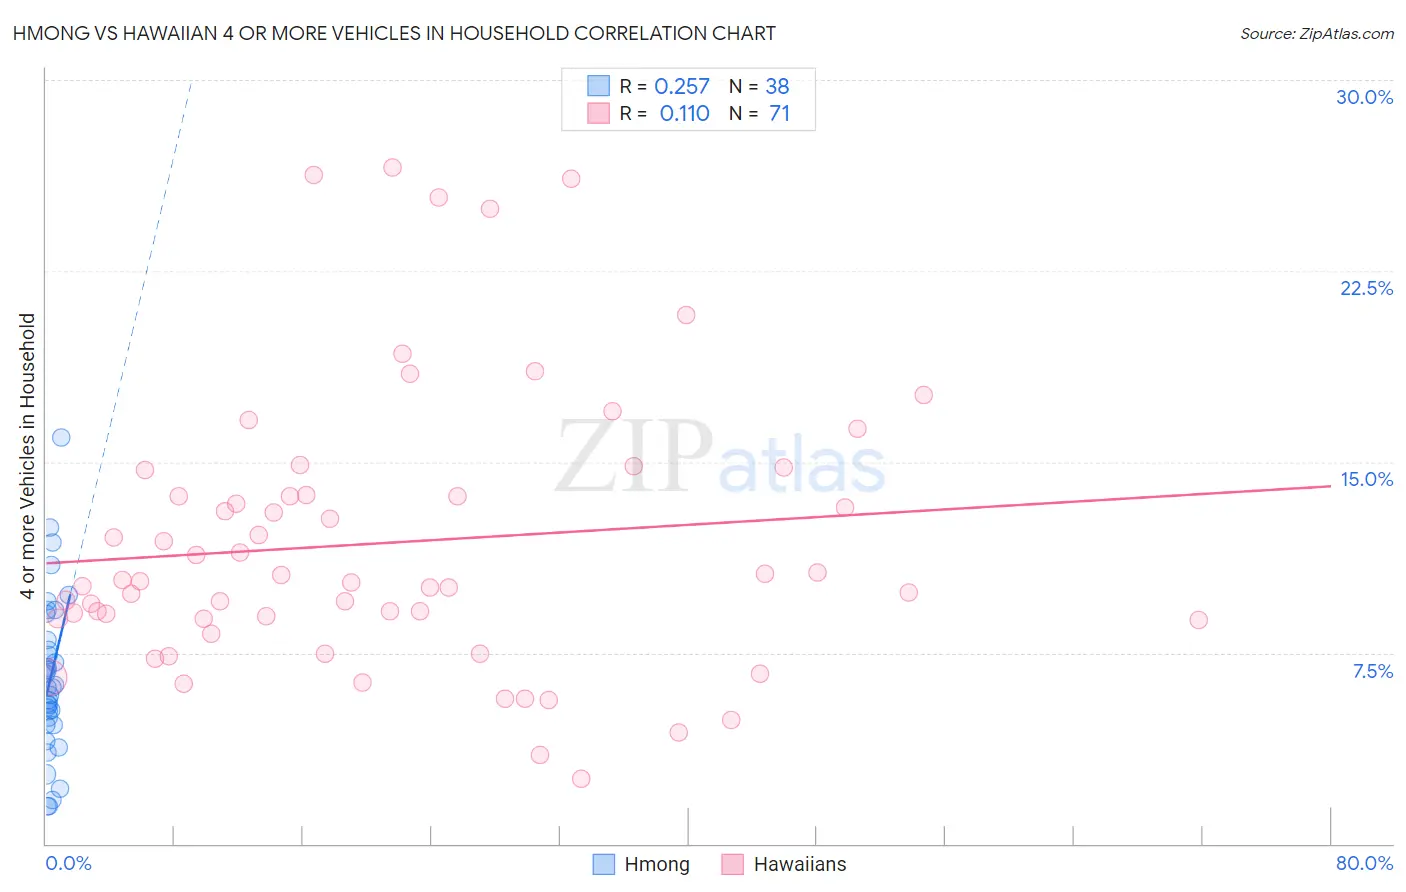
Hmong vs Hawaiian 4 or more Vehicles in Household Correlation Chart
The statistical analysis conducted on geographies consisting of 24,663,855 people shows a weak positive correlation between the proportion of Hmong and percentage of households with 4 or more vehicles available in the United States with a correlation coefficient (R) of 0.257 and weighted average of 7.0%. Similarly, the statistical analysis conducted on geographies consisting of 326,237,649 people shows a poor positive correlation between the proportion of Hawaiians and percentage of households with 4 or more vehicles available in the United States with a correlation coefficient (R) of 0.110 and weighted average of 8.9%, a difference of 28.1%.
4 or more Vehicles in Household Correlation Summary
| Measurement | Hmong | Hawaiian |
| Minimum | 1.5% | 2.6% |
| Maximum | 16.0% | 26.6% |
| Range | 14.5% | 24.0% |
| Mean | 6.5% | 11.8% |
| Median | 6.1% | 10.3% |
| Interquartile 25% (IQ1) | 4.7% | 8.8% |
| Interquartile 75% (IQ3) | 8.0% | 13.7% |
| Interquartile Range (IQR) | 3.3% | 4.9% |
| Standard Deviation (Sample) | 3.1% | 5.4% |
| Standard Deviation (Population) | 3.1% | 5.4% |
Similar Demographics by 4 or more Vehicles in Household
Demographics Similar to Hmong by 4 or more Vehicles in Household
In terms of 4 or more vehicles in household, the demographic groups most similar to Hmong are German Russian (7.0%, a difference of 0.0%), Guatemalan (7.0%, a difference of 0.35%), Nicaraguan (7.0%, a difference of 0.36%), Blackfeet (7.0%, a difference of 0.48%), and Asian (7.0%, a difference of 0.49%).
| Demographics | Rating | Rank | 4 or more Vehicles in Household |
| Celtics | 99.1 /100 | #97 | Exceptional 7.1% |
| Irish | 99.0 /100 | #98 | Exceptional 7.1% |
| Seminole | 98.8 /100 | #99 | Exceptional 7.0% |
| Taiwanese | 98.7 /100 | #100 | Exceptional 7.0% |
| Pakistanis | 98.7 /100 | #101 | Exceptional 7.0% |
| Asians | 98.6 /100 | #102 | Exceptional 7.0% |
| Blackfeet | 98.6 /100 | #103 | Exceptional 7.0% |
| Hmong | 98.3 /100 | #104 | Exceptional 7.0% |
| German Russians | 98.3 /100 | #105 | Exceptional 7.0% |
| Guatemalans | 98.1 /100 | #106 | Exceptional 7.0% |
| Nicaraguans | 98.0 /100 | #107 | Exceptional 7.0% |
| French | 97.7 /100 | #108 | Exceptional 6.9% |
| Filipinos | 97.6 /100 | #109 | Exceptional 6.9% |
| Immigrants | Thailand | 97.0 /100 | #110 | Exceptional 6.9% |
| Aleuts | 97.0 /100 | #111 | Exceptional 6.9% |
Demographics Similar to Hawaiians by 4 or more Vehicles in Household
In terms of 4 or more vehicles in household, the demographic groups most similar to Hawaiians are Mexican (8.9%, a difference of 0.010%), Immigrants from Mexico (9.0%, a difference of 0.69%), Paiute (9.0%, a difference of 0.81%), Chinese (8.8%, a difference of 1.0%), and Shoshone (8.8%, a difference of 1.0%).
| Demographics | Rating | Rank | 4 or more Vehicles in Household |
| Puget Sound Salish | 100.0 /100 | #6 | Exceptional 9.4% |
| Native Hawaiians | 100.0 /100 | #7 | Exceptional 9.4% |
| Arapaho | 100.0 /100 | #8 | Exceptional 9.4% |
| Samoans | 100.0 /100 | #9 | Exceptional 9.2% |
| Paiute | 100.0 /100 | #10 | Exceptional 9.0% |
| Immigrants | Mexico | 100.0 /100 | #11 | Exceptional 9.0% |
| Mexicans | 100.0 /100 | #12 | Exceptional 8.9% |
| Hawaiians | 100.0 /100 | #13 | Exceptional 8.9% |
| Chinese | 100.0 /100 | #14 | Exceptional 8.8% |
| Shoshone | 100.0 /100 | #15 | Exceptional 8.8% |
| Lumbee | 100.0 /100 | #16 | Exceptional 8.8% |
| Ute | 100.0 /100 | #17 | Exceptional 8.8% |
| Nepalese | 100.0 /100 | #18 | Exceptional 8.7% |
| Koreans | 100.0 /100 | #19 | Exceptional 8.6% |
| Pueblo | 100.0 /100 | #20 | Exceptional 8.6% |