Immigrants from India vs Lebanese 1 or more Vehicles in Household
COMPARE
Immigrants from India
Lebanese
1 or more Vehicles in Household
1 or more Vehicles in Household Comparison
Immigrants from India
Lebanese
91.9%
1 OR MORE VEHICLES IN HOUSEHOLD
99.8/ 100
METRIC RATING
61st/ 347
METRIC RANK
91.4%
1 OR MORE VEHICLES IN HOUSEHOLD
99.3/ 100
METRIC RATING
82nd/ 347
METRIC RANK
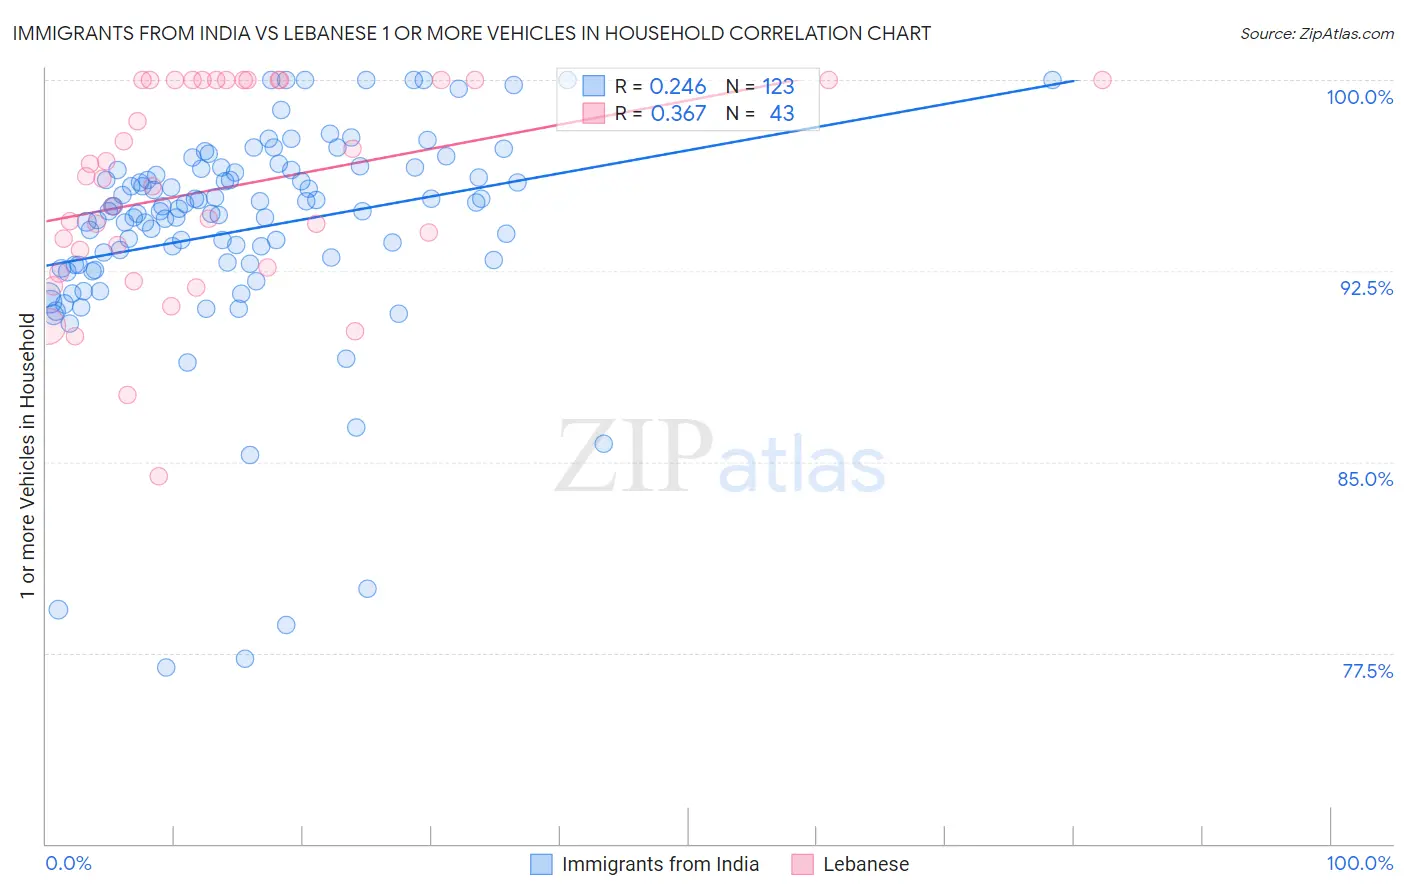
Immigrants from India vs Lebanese 1 or more Vehicles in Household Correlation Chart
The statistical analysis conducted on geographies consisting of 433,708,630 people shows a weak positive correlation between the proportion of Immigrants from India and percentage of households with 1 or more vehicles available in the United States with a correlation coefficient (R) of 0.246 and weighted average of 91.9%. Similarly, the statistical analysis conducted on geographies consisting of 401,375,965 people shows a mild positive correlation between the proportion of Lebanese and percentage of households with 1 or more vehicles available in the United States with a correlation coefficient (R) of 0.367 and weighted average of 91.4%, a difference of 0.49%.
1 or more Vehicles in Household Correlation Summary
| Measurement | Immigrants from India | Lebanese |
| Minimum | 76.9% | 84.4% |
| Maximum | 100.0% | 100.0% |
| Range | 23.1% | 15.6% |
| Mean | 94.1% | 95.7% |
| Median | 94.9% | 96.1% |
| Interquartile 25% (IQ1) | 92.7% | 92.6% |
| Interquartile 75% (IQ3) | 96.5% | 100.0% |
| Interquartile Range (IQR) | 3.7% | 7.4% |
| Standard Deviation (Sample) | 4.3% | 4.0% |
| Standard Deviation (Population) | 4.3% | 4.0% |
Similar Demographics by 1 or more Vehicles in Household
Demographics Similar to Immigrants from India by 1 or more Vehicles in Household
In terms of 1 or more vehicles in household, the demographic groups most similar to Immigrants from India are Thai (91.9%, a difference of 0.0%), Slovak (91.9%, a difference of 0.010%), Chinese (91.9%, a difference of 0.030%), Croatian (91.9%, a difference of 0.030%), and Venezuelan (91.9%, a difference of 0.040%).
| Demographics | Rating | Rank | 1 or more Vehicles in Household |
| Slovenes | 99.9 /100 | #54 | Exceptional 92.0% |
| Immigrants | Afghanistan | 99.9 /100 | #55 | Exceptional 92.0% |
| Immigrants | Venezuela | 99.9 /100 | #56 | Exceptional 92.0% |
| Iraqis | 99.8 /100 | #57 | Exceptional 91.9% |
| Immigrants | Mexico | 99.8 /100 | #58 | Exceptional 91.9% |
| Venezuelans | 99.8 /100 | #59 | Exceptional 91.9% |
| Slovaks | 99.8 /100 | #60 | Exceptional 91.9% |
| Immigrants | India | 99.8 /100 | #61 | Exceptional 91.9% |
| Thais | 99.8 /100 | #62 | Exceptional 91.9% |
| Chinese | 99.8 /100 | #63 | Exceptional 91.9% |
| Croatians | 99.8 /100 | #64 | Exceptional 91.9% |
| Immigrants | Laos | 99.8 /100 | #65 | Exceptional 91.8% |
| Canadians | 99.8 /100 | #66 | Exceptional 91.8% |
| Spaniards | 99.8 /100 | #67 | Exceptional 91.8% |
| Immigrants | Scotland | 99.7 /100 | #68 | Exceptional 91.8% |
Demographics Similar to Lebanese by 1 or more Vehicles in Household
In terms of 1 or more vehicles in household, the demographic groups most similar to Lebanese are Immigrants from England (91.4%, a difference of 0.0%), Immigrants from South Eastern Asia (91.4%, a difference of 0.010%), Jordanian (91.4%, a difference of 0.020%), Tsimshian (91.4%, a difference of 0.020%), and Immigrants from South Central Asia (91.5%, a difference of 0.040%).
| Demographics | Rating | Rank | 1 or more Vehicles in Household |
| Portuguese | 99.5 /100 | #75 | Exceptional 91.6% |
| Cubans | 99.5 /100 | #76 | Exceptional 91.5% |
| Immigrants | Philippines | 99.4 /100 | #77 | Exceptional 91.5% |
| Iranians | 99.4 /100 | #78 | Exceptional 91.5% |
| Immigrants | South Central Asia | 99.4 /100 | #79 | Exceptional 91.5% |
| Bolivians | 99.4 /100 | #80 | Exceptional 91.5% |
| Immigrants | South Eastern Asia | 99.3 /100 | #81 | Exceptional 91.4% |
| Lebanese | 99.3 /100 | #82 | Exceptional 91.4% |
| Immigrants | England | 99.3 /100 | #83 | Exceptional 91.4% |
| Jordanians | 99.3 /100 | #84 | Exceptional 91.4% |
| Tsimshian | 99.3 /100 | #85 | Exceptional 91.4% |
| Osage | 99.2 /100 | #86 | Exceptional 91.4% |
| Immigrants | Germany | 99.2 /100 | #87 | Exceptional 91.4% |
| Spanish Americans | 99.2 /100 | #88 | Exceptional 91.4% |
| Bangladeshis | 99.2 /100 | #89 | Exceptional 91.4% |