Guatemalan vs Scottish No Vehicles in Household
COMPARE
Guatemalan
Scottish
No Vehicles in Household
No Vehicles in Household Comparison
Guatemalans
Scottish
11.0%
NO VEHICLES IN HOUSEHOLD
16.1/ 100
METRIC RATING
204th/ 347
METRIC RANK
6.8%
NO VEHICLES IN HOUSEHOLD
100.0/ 100
METRIC RATING
7th/ 347
METRIC RANK
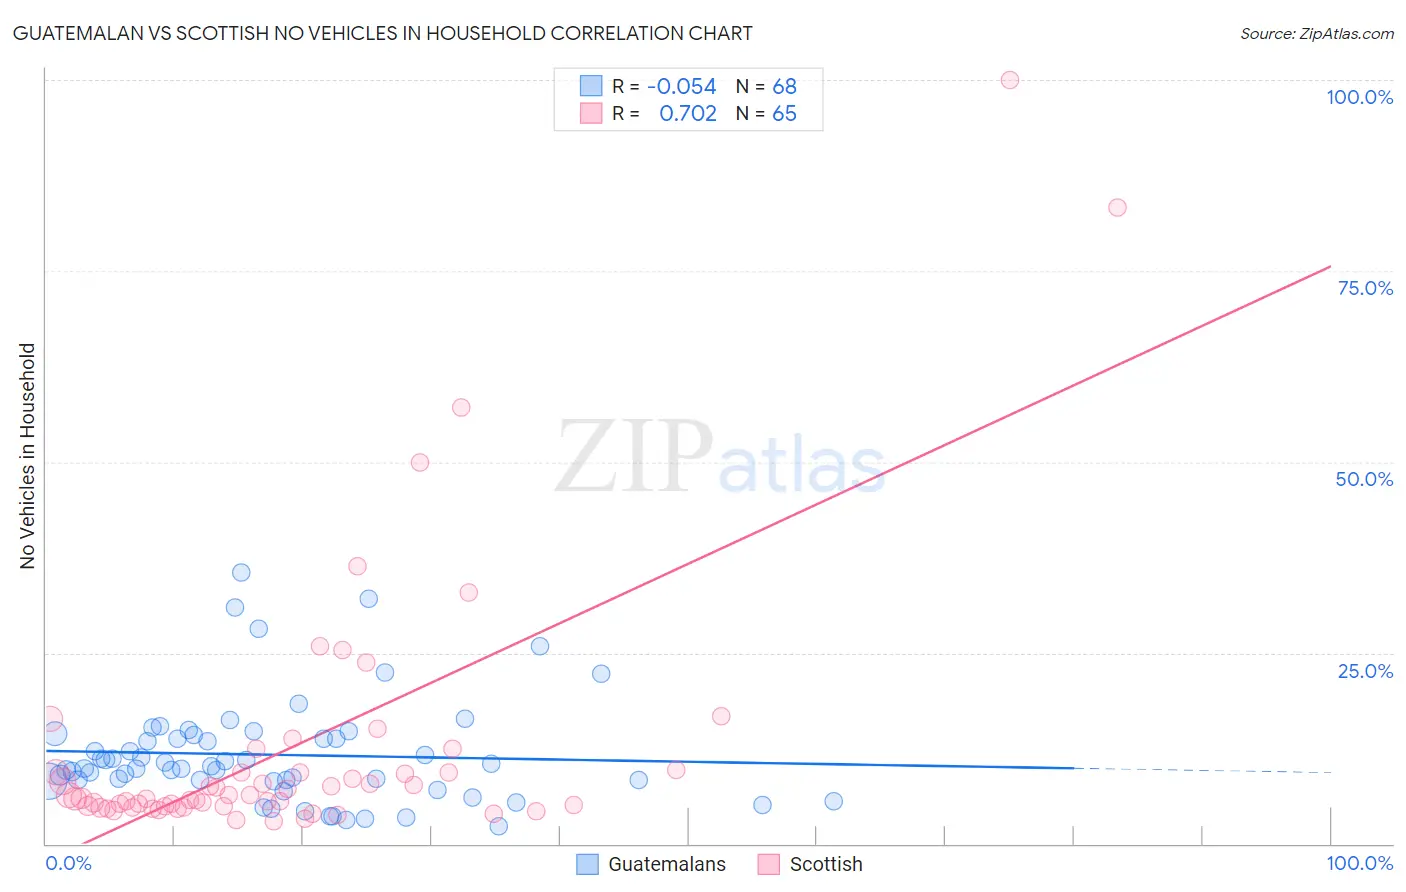
Guatemalan vs Scottish No Vehicles in Household Correlation Chart
The statistical analysis conducted on geographies consisting of 408,589,655 people shows a slight negative correlation between the proportion of Guatemalans and percentage of households with no vehicle available in the United States with a correlation coefficient (R) of -0.054 and weighted average of 11.0%. Similarly, the statistical analysis conducted on geographies consisting of 561,431,251 people shows a strong positive correlation between the proportion of Scottish and percentage of households with no vehicle available in the United States with a correlation coefficient (R) of 0.702 and weighted average of 6.8%, a difference of 62.5%.
No Vehicles in Household Correlation Summary
| Measurement | Guatemalan | Scottish |
| Minimum | 2.3% | 3.0% |
| Maximum | 35.5% | 100.0% |
| Range | 33.2% | 97.0% |
| Mean | 11.7% | 12.6% |
| Median | 10.0% | 6.3% |
| Interquartile 25% (IQ1) | 8.3% | 4.9% |
| Interquartile 75% (IQ3) | 13.9% | 9.5% |
| Interquartile Range (IQR) | 5.6% | 4.6% |
| Standard Deviation (Sample) | 6.9% | 17.6% |
| Standard Deviation (Population) | 6.8% | 17.5% |
Similar Demographics by No Vehicles in Household
Demographics Similar to Guatemalans by No Vehicles in Household
In terms of no vehicles in household, the demographic groups most similar to Guatemalans are Immigrants from Chile (11.0%, a difference of 0.040%), Somali (11.0%, a difference of 0.050%), Sierra Leonean (11.0%, a difference of 0.10%), Immigrants from Italy (11.0%, a difference of 0.11%), and Pennsylvania German (11.0%, a difference of 0.14%).
| Demographics | Rating | Rank | No Vehicles in Household |
| Shoshone | 24.1 /100 | #197 | Fair 10.8% |
| Immigrants | Sweden | 22.9 /100 | #198 | Fair 10.8% |
| Immigrants | Asia | 21.3 /100 | #199 | Fair 10.9% |
| Cambodians | 19.6 /100 | #200 | Poor 10.9% |
| Immigrants | Western Europe | 19.1 /100 | #201 | Poor 10.9% |
| Romanians | 17.9 /100 | #202 | Poor 10.9% |
| Iroquois | 17.6 /100 | #203 | Poor 10.9% |
| Guatemalans | 16.1 /100 | #204 | Poor 11.0% |
| Immigrants | Chile | 15.9 /100 | #205 | Poor 11.0% |
| Somalis | 15.9 /100 | #206 | Poor 11.0% |
| Sierra Leoneans | 15.7 /100 | #207 | Poor 11.0% |
| Immigrants | Italy | 15.6 /100 | #208 | Poor 11.0% |
| Pennsylvania Germans | 15.5 /100 | #209 | Poor 11.0% |
| Apache | 14.8 /100 | #210 | Poor 11.0% |
| Crow | 14.2 /100 | #211 | Poor 11.0% |
Demographics Similar to Scottish by No Vehicles in Household
In terms of no vehicles in household, the demographic groups most similar to Scottish are Swedish (6.8%, a difference of 0.47%), Scotch-Irish (6.8%, a difference of 0.68%), Dutch (6.8%, a difference of 1.2%), German (6.7%, a difference of 1.3%), and Czech (6.9%, a difference of 1.8%).
| Demographics | Rating | Rank | No Vehicles in Household |
| Luxembourgers | 100.0 /100 | #1 | Exceptional 5.4% |
| Norwegians | 100.0 /100 | #2 | Exceptional 6.4% |
| English | 100.0 /100 | #3 | Exceptional 6.5% |
| Danes | 100.0 /100 | #4 | Exceptional 6.6% |
| Yakama | 100.0 /100 | #5 | Exceptional 6.6% |
| Germans | 100.0 /100 | #6 | Exceptional 6.7% |
| Scottish | 100.0 /100 | #7 | Exceptional 6.8% |
| Swedes | 100.0 /100 | #8 | Exceptional 6.8% |
| Scotch-Irish | 100.0 /100 | #9 | Exceptional 6.8% |
| Dutch | 100.0 /100 | #10 | Exceptional 6.8% |
| Czechs | 100.0 /100 | #11 | Exceptional 6.9% |
| Assyrians/Chaldeans/Syriacs | 100.0 /100 | #12 | Exceptional 7.0% |
| Scandinavians | 100.0 /100 | #13 | Exceptional 7.0% |
| Mexicans | 100.0 /100 | #14 | Exceptional 7.0% |
| Whites/Caucasians | 100.0 /100 | #15 | Exceptional 7.0% |