Ghanaian vs American 1 or more Vehicles in Household
COMPARE
Ghanaian
American
1 or more Vehicles in Household
1 or more Vehicles in Household Comparison
Ghanaians
Americans
83.6%
1 OR MORE VEHICLES IN HOUSEHOLD
0.0/ 100
METRIC RATING
317th/ 347
METRIC RANK
92.5%
1 OR MORE VEHICLES IN HOUSEHOLD
100.0/ 100
METRIC RATING
27th/ 347
METRIC RANK
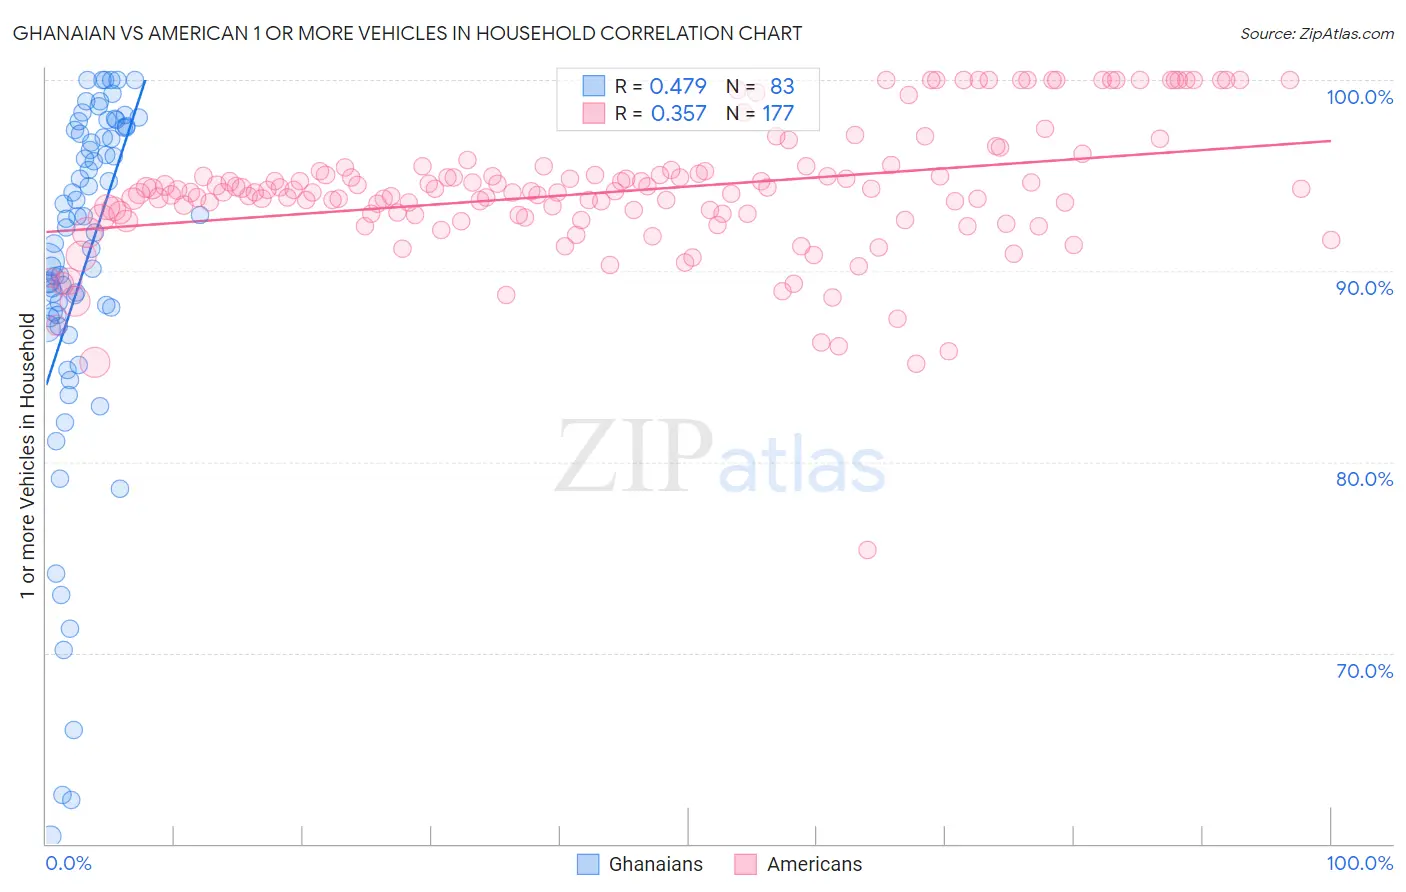
Ghanaian vs American 1 or more Vehicles in Household Correlation Chart
The statistical analysis conducted on geographies consisting of 190,247,159 people shows a moderate positive correlation between the proportion of Ghanaians and percentage of households with 1 or more vehicles available in the United States with a correlation coefficient (R) of 0.479 and weighted average of 83.6%. Similarly, the statistical analysis conducted on geographies consisting of 581,473,856 people shows a mild positive correlation between the proportion of Americans and percentage of households with 1 or more vehicles available in the United States with a correlation coefficient (R) of 0.357 and weighted average of 92.5%, a difference of 10.6%.
1 or more Vehicles in Household Correlation Summary
| Measurement | Ghanaian | American |
| Minimum | 60.4% | 75.4% |
| Maximum | 100.0% | 100.0% |
| Range | 39.6% | 24.6% |
| Mean | 90.1% | 94.2% |
| Median | 92.3% | 94.1% |
| Interquartile 25% (IQ1) | 87.6% | 92.9% |
| Interquartile 75% (IQ3) | 97.4% | 95.2% |
| Interquartile Range (IQR) | 9.8% | 2.4% |
| Standard Deviation (Sample) | 9.3% | 3.5% |
| Standard Deviation (Population) | 9.2% | 3.5% |
Similar Demographics by 1 or more Vehicles in Household
Demographics Similar to Ghanaians by 1 or more Vehicles in Household
In terms of 1 or more vehicles in household, the demographic groups most similar to Ghanaians are Immigrants from Ghana (83.4%, a difference of 0.20%), Alaska Native (83.8%, a difference of 0.22%), Immigrants from Belarus (83.3%, a difference of 0.34%), Cypriot (84.4%, a difference of 0.91%), and Albanian (84.4%, a difference of 0.98%).
| Demographics | Rating | Rank | 1 or more Vehicles in Household |
| U.S. Virgin Islanders | 0.0 /100 | #310 | Tragic 84.6% |
| Puerto Ricans | 0.0 /100 | #311 | Tragic 84.6% |
| Cape Verdeans | 0.0 /100 | #312 | Tragic 84.5% |
| Immigrants | Israel | 0.0 /100 | #313 | Tragic 84.5% |
| Albanians | 0.0 /100 | #314 | Tragic 84.4% |
| Cypriots | 0.0 /100 | #315 | Tragic 84.4% |
| Alaska Natives | 0.0 /100 | #316 | Tragic 83.8% |
| Ghanaians | 0.0 /100 | #317 | Tragic 83.6% |
| Immigrants | Ghana | 0.0 /100 | #318 | Tragic 83.4% |
| Immigrants | Belarus | 0.0 /100 | #319 | Tragic 83.3% |
| Soviet Union | 0.0 /100 | #320 | Tragic 82.7% |
| Jamaicans | 0.0 /100 | #321 | Tragic 82.1% |
| Immigrants | Cabo Verde | 0.0 /100 | #322 | Tragic 81.6% |
| Immigrants | Yemen | 0.0 /100 | #323 | Tragic 80.5% |
| Immigrants | Caribbean | 0.0 /100 | #324 | Tragic 80.4% |
Demographics Similar to Americans by 1 or more Vehicles in Household
In terms of 1 or more vehicles in household, the demographic groups most similar to Americans are Sri Lankan (92.5%, a difference of 0.030%), British (92.5%, a difference of 0.050%), Native Hawaiian (92.4%, a difference of 0.050%), Finnish (92.4%, a difference of 0.050%), and Immigrants from Iraq (92.5%, a difference of 0.060%).
| Demographics | Rating | Rank | 1 or more Vehicles in Household |
| Arapaho | 100.0 /100 | #20 | Exceptional 92.7% |
| Ottawa | 100.0 /100 | #21 | Exceptional 92.7% |
| French | 100.0 /100 | #22 | Exceptional 92.7% |
| Nepalese | 100.0 /100 | #23 | Exceptional 92.6% |
| Yaqui | 100.0 /100 | #24 | Exceptional 92.6% |
| Immigrants | Iraq | 100.0 /100 | #25 | Exceptional 92.5% |
| British | 100.0 /100 | #26 | Exceptional 92.5% |
| Americans | 100.0 /100 | #27 | Exceptional 92.5% |
| Sri Lankans | 100.0 /100 | #28 | Exceptional 92.5% |
| Native Hawaiians | 100.0 /100 | #29 | Exceptional 92.4% |
| Finns | 100.0 /100 | #30 | Exceptional 92.4% |
| Samoans | 100.0 /100 | #31 | Exceptional 92.4% |
| Basques | 100.0 /100 | #32 | Exceptional 92.4% |
| Cherokee | 100.0 /100 | #33 | Exceptional 92.4% |
| Italians | 99.9 /100 | #34 | Exceptional 92.3% |