Ghanaian vs Celtic 1 or more Vehicles in Household
COMPARE
Ghanaian
Celtic
1 or more Vehicles in Household
1 or more Vehicles in Household Comparison
Ghanaians
Celtics
83.6%
1 OR MORE VEHICLES IN HOUSEHOLD
0.0/ 100
METRIC RATING
317th/ 347
METRIC RANK
92.1%
1 OR MORE VEHICLES IN HOUSEHOLD
99.9/ 100
METRIC RATING
51st/ 347
METRIC RANK
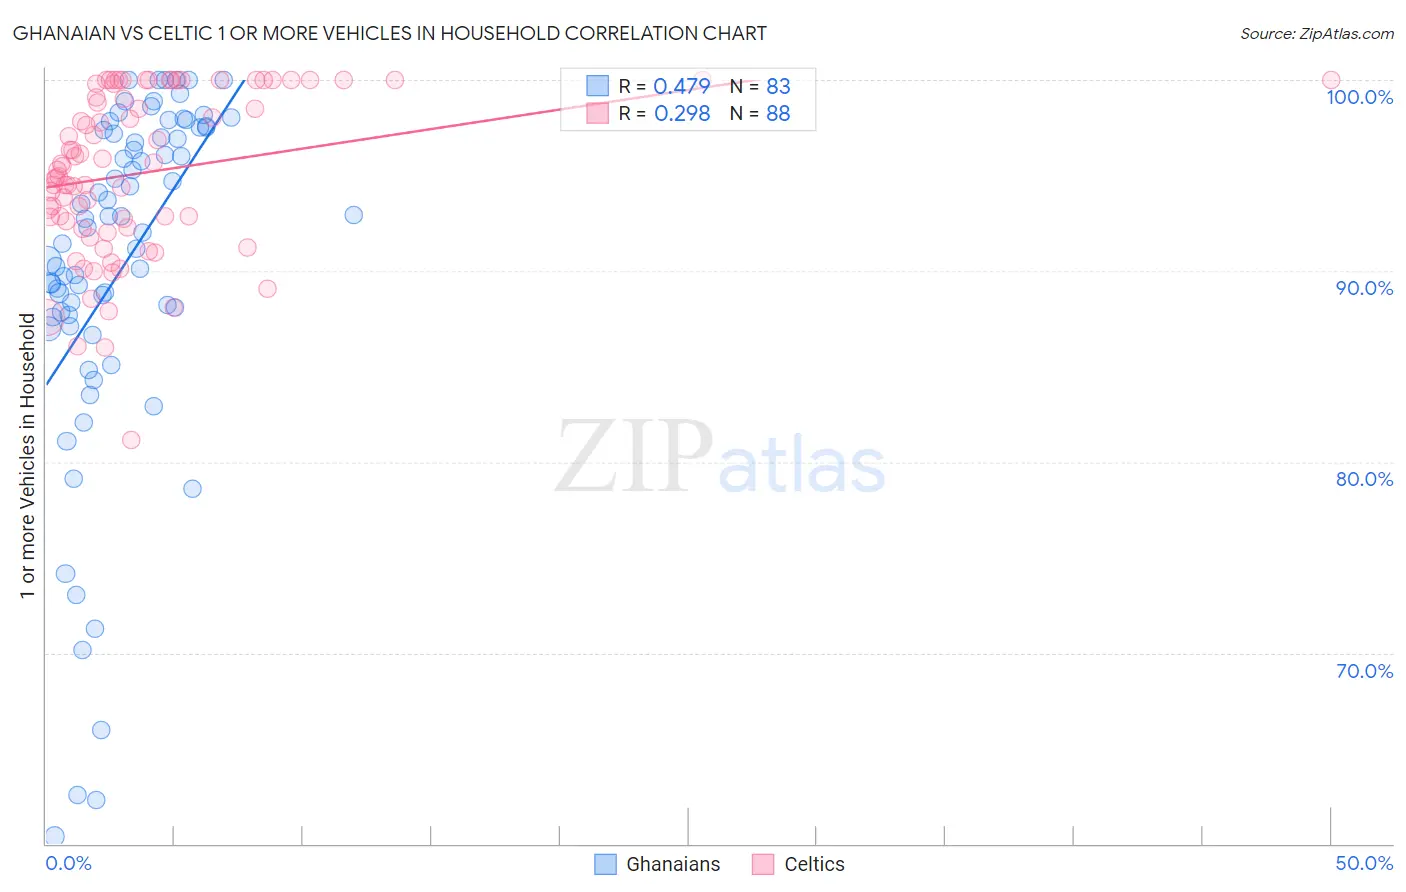
Ghanaian vs Celtic 1 or more Vehicles in Household Correlation Chart
The statistical analysis conducted on geographies consisting of 190,247,159 people shows a moderate positive correlation between the proportion of Ghanaians and percentage of households with 1 or more vehicles available in the United States with a correlation coefficient (R) of 0.479 and weighted average of 83.6%. Similarly, the statistical analysis conducted on geographies consisting of 168,861,273 people shows a weak positive correlation between the proportion of Celtics and percentage of households with 1 or more vehicles available in the United States with a correlation coefficient (R) of 0.298 and weighted average of 92.1%, a difference of 10.1%.
1 or more Vehicles in Household Correlation Summary
| Measurement | Ghanaian | Celtic |
| Minimum | 60.4% | 81.1% |
| Maximum | 100.0% | 100.0% |
| Range | 39.6% | 18.9% |
| Mean | 90.1% | 95.2% |
| Median | 92.3% | 95.4% |
| Interquartile 25% (IQ1) | 87.6% | 92.4% |
| Interquartile 75% (IQ3) | 97.4% | 99.8% |
| Interquartile Range (IQR) | 9.8% | 7.4% |
| Standard Deviation (Sample) | 9.3% | 4.2% |
| Standard Deviation (Population) | 9.2% | 4.2% |
Similar Demographics by 1 or more Vehicles in Household
Demographics Similar to Ghanaians by 1 or more Vehicles in Household
In terms of 1 or more vehicles in household, the demographic groups most similar to Ghanaians are Immigrants from Ghana (83.4%, a difference of 0.20%), Alaska Native (83.8%, a difference of 0.22%), Immigrants from Belarus (83.3%, a difference of 0.34%), Cypriot (84.4%, a difference of 0.91%), and Albanian (84.4%, a difference of 0.98%).
| Demographics | Rating | Rank | 1 or more Vehicles in Household |
| U.S. Virgin Islanders | 0.0 /100 | #310 | Tragic 84.6% |
| Puerto Ricans | 0.0 /100 | #311 | Tragic 84.6% |
| Cape Verdeans | 0.0 /100 | #312 | Tragic 84.5% |
| Immigrants | Israel | 0.0 /100 | #313 | Tragic 84.5% |
| Albanians | 0.0 /100 | #314 | Tragic 84.4% |
| Cypriots | 0.0 /100 | #315 | Tragic 84.4% |
| Alaska Natives | 0.0 /100 | #316 | Tragic 83.8% |
| Ghanaians | 0.0 /100 | #317 | Tragic 83.6% |
| Immigrants | Ghana | 0.0 /100 | #318 | Tragic 83.4% |
| Immigrants | Belarus | 0.0 /100 | #319 | Tragic 83.3% |
| Soviet Union | 0.0 /100 | #320 | Tragic 82.7% |
| Jamaicans | 0.0 /100 | #321 | Tragic 82.1% |
| Immigrants | Cabo Verde | 0.0 /100 | #322 | Tragic 81.6% |
| Immigrants | Yemen | 0.0 /100 | #323 | Tragic 80.5% |
| Immigrants | Caribbean | 0.0 /100 | #324 | Tragic 80.4% |
Demographics Similar to Celtics by 1 or more Vehicles in Household
In terms of 1 or more vehicles in household, the demographic groups most similar to Celtics are Guamanian/Chamorro (92.1%, a difference of 0.010%), Afghan (92.1%, a difference of 0.020%), Belgian (92.1%, a difference of 0.030%), Korean (92.1%, a difference of 0.030%), and Hawaiian (92.0%, a difference of 0.060%).
| Demographics | Rating | Rank | 1 or more Vehicles in Household |
| Choctaw | 99.9 /100 | #44 | Exceptional 92.2% |
| Immigrants | Nonimmigrants | 99.9 /100 | #45 | Exceptional 92.2% |
| Immigrants | Fiji | 99.9 /100 | #46 | Exceptional 92.2% |
| Northern Europeans | 99.9 /100 | #47 | Exceptional 92.2% |
| Belgians | 99.9 /100 | #48 | Exceptional 92.1% |
| Afghans | 99.9 /100 | #49 | Exceptional 92.1% |
| Guamanians/Chamorros | 99.9 /100 | #50 | Exceptional 92.1% |
| Celtics | 99.9 /100 | #51 | Exceptional 92.1% |
| Koreans | 99.9 /100 | #52 | Exceptional 92.1% |
| Hawaiians | 99.9 /100 | #53 | Exceptional 92.0% |
| Slovenes | 99.9 /100 | #54 | Exceptional 92.0% |
| Immigrants | Afghanistan | 99.9 /100 | #55 | Exceptional 92.0% |
| Immigrants | Venezuela | 99.9 /100 | #56 | Exceptional 92.0% |
| Iraqis | 99.8 /100 | #57 | Exceptional 91.9% |
| Immigrants | Mexico | 99.8 /100 | #58 | Exceptional 91.9% |