Filipino vs Hopi 1 or more Vehicles in Household
COMPARE
Filipino
Hopi
1 or more Vehicles in Household
1 or more Vehicles in Household Comparison
Filipinos
Hopi
89.7%
1 OR MORE VEHICLES IN HOUSEHOLD
50.0/ 100
METRIC RATING
174th/ 347
METRIC RANK
86.4%
1 OR MORE VEHICLES IN HOUSEHOLD
0.0/ 100
METRIC RATING
288th/ 347
METRIC RANK
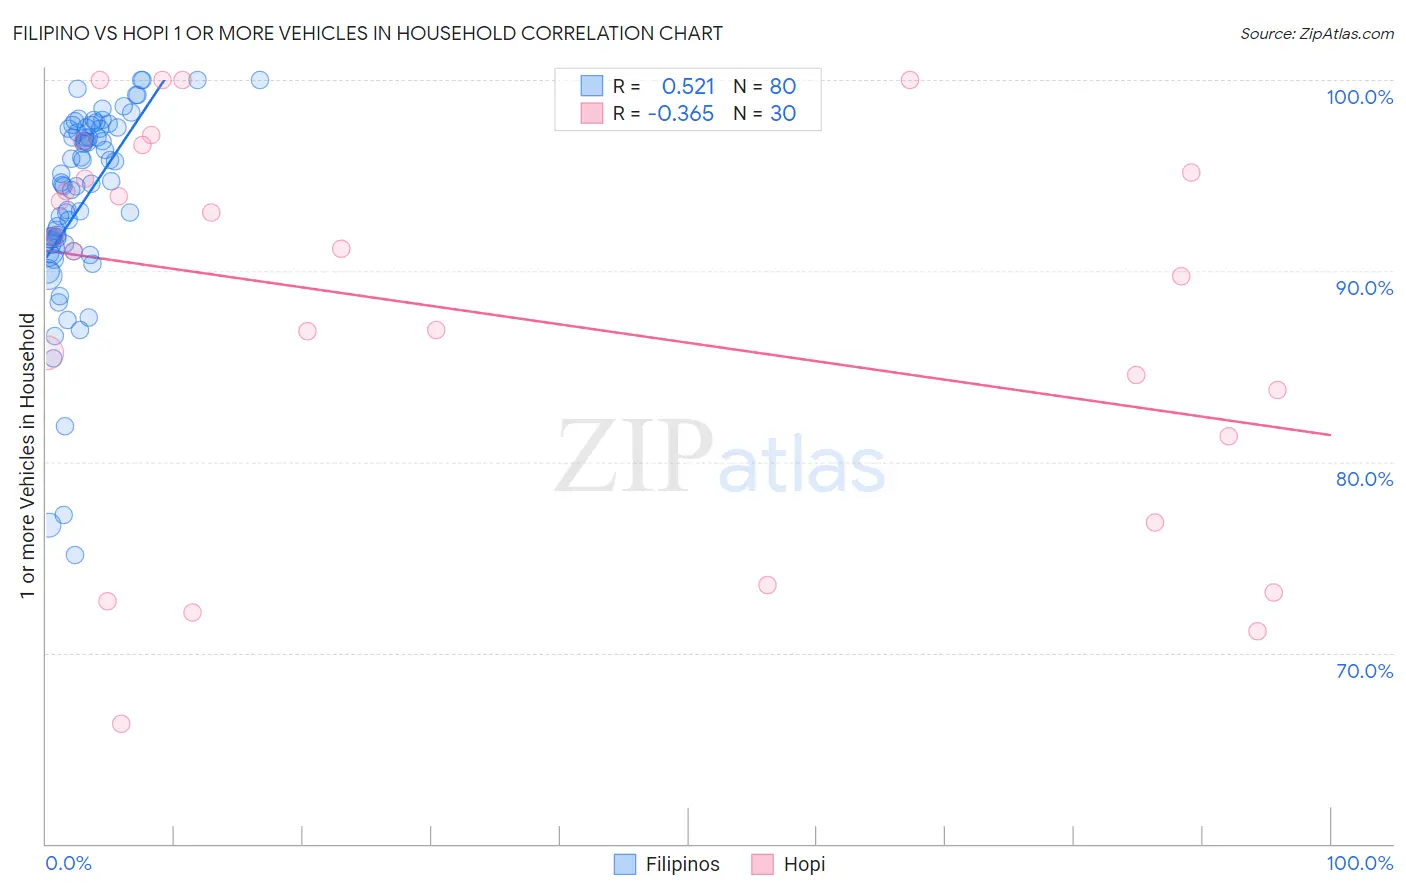
Filipino vs Hopi 1 or more Vehicles in Household Correlation Chart
The statistical analysis conducted on geographies consisting of 254,177,454 people shows a substantial positive correlation between the proportion of Filipinos and percentage of households with 1 or more vehicles available in the United States with a correlation coefficient (R) of 0.521 and weighted average of 89.7%. Similarly, the statistical analysis conducted on geographies consisting of 74,733,532 people shows a mild negative correlation between the proportion of Hopi and percentage of households with 1 or more vehicles available in the United States with a correlation coefficient (R) of -0.365 and weighted average of 86.4%, a difference of 3.8%.
1 or more Vehicles in Household Correlation Summary
| Measurement | Filipino | Hopi |
| Minimum | 75.1% | 66.3% |
| Maximum | 100.0% | 100.0% |
| Range | 24.9% | 33.7% |
| Mean | 93.7% | 87.8% |
| Median | 94.7% | 91.1% |
| Interquartile 25% (IQ1) | 91.4% | 81.3% |
| Interquartile 75% (IQ3) | 97.5% | 95.2% |
| Interquartile Range (IQR) | 6.0% | 13.9% |
| Standard Deviation (Sample) | 5.2% | 10.1% |
| Standard Deviation (Population) | 5.1% | 9.9% |
Similar Demographics by 1 or more Vehicles in Household
Demographics Similar to Filipinos by 1 or more Vehicles in Household
In terms of 1 or more vehicles in household, the demographic groups most similar to Filipinos are Lumbee (89.7%, a difference of 0.040%), Immigrants from Burma/Myanmar (89.7%, a difference of 0.040%), Indonesian (89.7%, a difference of 0.050%), Immigrants from Sudan (89.7%, a difference of 0.050%), and French American Indian (89.8%, a difference of 0.070%).
| Demographics | Rating | Rank | 1 or more Vehicles in Household |
| Immigrants | Latin America | 60.3 /100 | #167 | Good 89.8% |
| Immigrants | Cambodia | 60.1 /100 | #168 | Good 89.8% |
| Natives/Alaskans | 59.5 /100 | #169 | Average 89.8% |
| Immigrants | Costa Rica | 57.6 /100 | #170 | Average 89.8% |
| French American Indians | 54.4 /100 | #171 | Average 89.8% |
| Indonesians | 53.0 /100 | #172 | Average 89.7% |
| Lumbee | 52.8 /100 | #173 | Average 89.7% |
| Filipinos | 50.0 /100 | #174 | Average 89.7% |
| Immigrants | Burma/Myanmar | 47.6 /100 | #175 | Average 89.7% |
| Immigrants | Sudan | 47.1 /100 | #176 | Average 89.7% |
| Hmong | 45.8 /100 | #177 | Average 89.6% |
| Immigrants | El Salvador | 44.1 /100 | #178 | Average 89.6% |
| German Russians | 44.0 /100 | #179 | Average 89.6% |
| Arabs | 43.3 /100 | #180 | Average 89.6% |
| Immigrants | Ethiopia | 42.5 /100 | #181 | Average 89.6% |
Demographics Similar to Hopi by 1 or more Vehicles in Household
In terms of 1 or more vehicles in household, the demographic groups most similar to Hopi are Immigrants from Ireland (86.4%, a difference of 0.020%), Immigrants from Australia (86.4%, a difference of 0.060%), Immigrants from Malaysia (86.5%, a difference of 0.070%), Pima (86.3%, a difference of 0.14%), and Immigrants from Eastern Asia (86.5%, a difference of 0.15%).
| Demographics | Rating | Rank | 1 or more Vehicles in Household |
| Mongolians | 0.0 /100 | #281 | Tragic 87.0% |
| Colville | 0.0 /100 | #282 | Tragic 86.8% |
| Immigrants | Eastern Europe | 0.0 /100 | #283 | Tragic 86.7% |
| Central American Indians | 0.0 /100 | #284 | Tragic 86.7% |
| Immigrants | Kazakhstan | 0.0 /100 | #285 | Tragic 86.6% |
| Immigrants | Eastern Asia | 0.0 /100 | #286 | Tragic 86.5% |
| Immigrants | Malaysia | 0.0 /100 | #287 | Tragic 86.5% |
| Hopi | 0.0 /100 | #288 | Tragic 86.4% |
| Immigrants | Ireland | 0.0 /100 | #289 | Tragic 86.4% |
| Immigrants | Australia | 0.0 /100 | #290 | Tragic 86.4% |
| Pima | 0.0 /100 | #291 | Tragic 86.3% |
| Okinawans | 0.0 /100 | #292 | Tragic 86.1% |
| Indians (Asian) | 0.0 /100 | #293 | Tragic 86.0% |
| Alaskan Athabascans | 0.0 /100 | #294 | Tragic 86.0% |
| Immigrants | Jamaica | 0.0 /100 | #295 | Tragic 85.8% |