Estonian vs Brazilian 1 or more Vehicles in Household
COMPARE
Estonian
Brazilian
1 or more Vehicles in Household
1 or more Vehicles in Household Comparison
Estonians
Brazilians
90.3%
1 OR MORE VEHICLES IN HOUSEHOLD
85.6/ 100
METRIC RATING
139th/ 347
METRIC RANK
90.0%
1 OR MORE VEHICLES IN HOUSEHOLD
71.0/ 100
METRIC RATING
158th/ 347
METRIC RANK
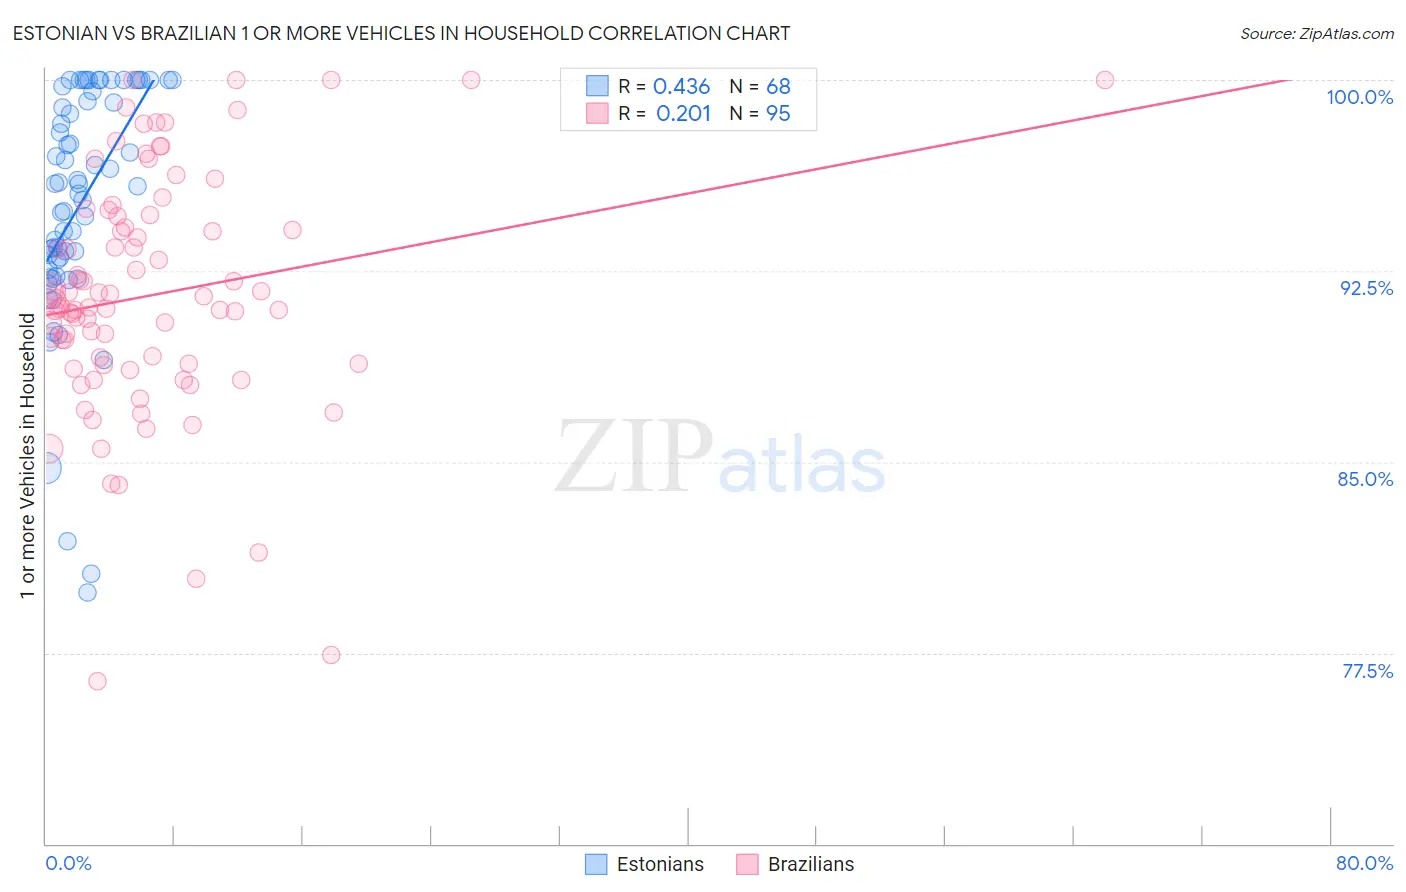
Estonian vs Brazilian 1 or more Vehicles in Household Correlation Chart
The statistical analysis conducted on geographies consisting of 123,503,955 people shows a moderate positive correlation between the proportion of Estonians and percentage of households with 1 or more vehicles available in the United States with a correlation coefficient (R) of 0.436 and weighted average of 90.3%. Similarly, the statistical analysis conducted on geographies consisting of 323,363,062 people shows a weak positive correlation between the proportion of Brazilians and percentage of households with 1 or more vehicles available in the United States with a correlation coefficient (R) of 0.201 and weighted average of 90.0%, a difference of 0.35%.
1 or more Vehicles in Household Correlation Summary
| Measurement | Estonian | Brazilian |
| Minimum | 79.9% | 76.4% |
| Maximum | 100.0% | 100.0% |
| Range | 20.1% | 23.6% |
| Mean | 95.1% | 91.5% |
| Median | 95.9% | 91.1% |
| Interquartile 25% (IQ1) | 92.7% | 88.8% |
| Interquartile 75% (IQ3) | 99.4% | 94.6% |
| Interquartile Range (IQR) | 6.6% | 5.8% |
| Standard Deviation (Sample) | 4.7% | 4.7% |
| Standard Deviation (Population) | 4.6% | 4.7% |
Demographics Similar to Estonians and Brazilians by 1 or more Vehicles in Household
In terms of 1 or more vehicles in household, the demographic groups most similar to Estonians are Sudanese (90.3%, a difference of 0.010%), Syrian (90.3%, a difference of 0.020%), Immigrants from Moldova (90.2%, a difference of 0.070%), Immigrants from Lithuania (90.2%, a difference of 0.080%), and Immigrants from Bahamas (90.2%, a difference of 0.12%). Similarly, the demographic groups most similar to Brazilians are Immigrants from Congo (90.0%, a difference of 0.0%), Australian (90.0%, a difference of 0.030%), Immigrants (90.1%, a difference of 0.050%), Tlingit-Haida (90.1%, a difference of 0.060%), and New Zealander (90.1%, a difference of 0.060%).
| Demographics | Rating | Rank | 1 or more Vehicles in Household |
| Syrians | 86.3 /100 | #138 | Excellent 90.3% |
| Estonians | 85.6 /100 | #139 | Excellent 90.3% |
| Sudanese | 85.2 /100 | #140 | Excellent 90.3% |
| Immigrants | Moldova | 83.1 /100 | #141 | Excellent 90.2% |
| Immigrants | Lithuania | 83.0 /100 | #142 | Excellent 90.2% |
| Immigrants | Bahamas | 81.5 /100 | #143 | Excellent 90.2% |
| Immigrants | Zimbabwe | 81.5 /100 | #144 | Excellent 90.2% |
| Sioux | 81.3 /100 | #145 | Excellent 90.2% |
| Bahamians | 80.5 /100 | #146 | Excellent 90.2% |
| Chileans | 79.8 /100 | #147 | Good 90.2% |
| Immigrants | Eastern Africa | 78.2 /100 | #148 | Good 90.1% |
| Immigrants | Nicaragua | 76.7 /100 | #149 | Good 90.1% |
| Immigrants | Micronesia | 75.9 /100 | #150 | Good 90.1% |
| Immigrants | Bosnia and Herzegovina | 75.4 /100 | #151 | Good 90.1% |
| Tlingit-Haida | 74.3 /100 | #152 | Good 90.1% |
| New Zealanders | 73.8 /100 | #153 | Good 90.1% |
| Immigrants | Uganda | 73.8 /100 | #154 | Good 90.1% |
| Immigrants | Immigrants | 73.6 /100 | #155 | Good 90.1% |
| Australians | 72.4 /100 | #156 | Good 90.0% |
| Immigrants | Congo | 71.2 /100 | #157 | Good 90.0% |
| Brazilians | 71.0 /100 | #158 | Good 90.0% |