Estonian vs Immigrants from Vietnam 1 or more Vehicles in Household
COMPARE
Estonian
Immigrants from Vietnam
1 or more Vehicles in Household
1 or more Vehicles in Household Comparison
Estonians
Immigrants from Vietnam
90.3%
1 OR MORE VEHICLES IN HOUSEHOLD
85.6/ 100
METRIC RATING
139th/ 347
METRIC RANK
92.3%
1 OR MORE VEHICLES IN HOUSEHOLD
99.9/ 100
METRIC RATING
38th/ 347
METRIC RANK
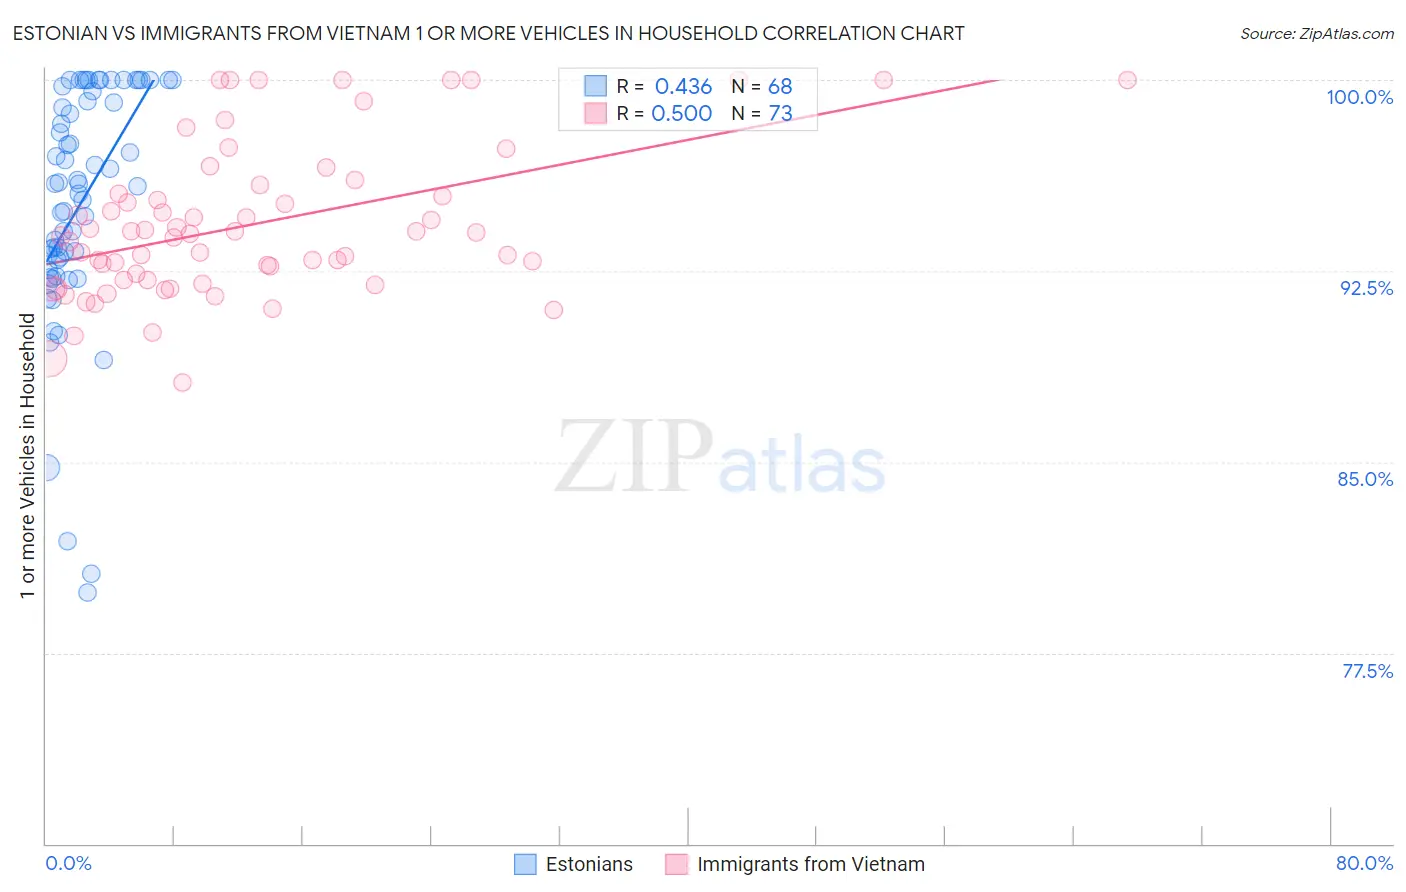
Estonian vs Immigrants from Vietnam 1 or more Vehicles in Household Correlation Chart
The statistical analysis conducted on geographies consisting of 123,503,955 people shows a moderate positive correlation between the proportion of Estonians and percentage of households with 1 or more vehicles available in the United States with a correlation coefficient (R) of 0.436 and weighted average of 90.3%. Similarly, the statistical analysis conducted on geographies consisting of 404,601,572 people shows a substantial positive correlation between the proportion of Immigrants from Vietnam and percentage of households with 1 or more vehicles available in the United States with a correlation coefficient (R) of 0.500 and weighted average of 92.3%, a difference of 2.2%.
1 or more Vehicles in Household Correlation Summary
| Measurement | Estonian | Immigrants from Vietnam |
| Minimum | 79.9% | 88.1% |
| Maximum | 100.0% | 100.0% |
| Range | 20.1% | 11.9% |
| Mean | 95.1% | 94.3% |
| Median | 95.9% | 93.9% |
| Interquartile 25% (IQ1) | 92.7% | 92.1% |
| Interquartile 75% (IQ3) | 99.4% | 95.7% |
| Interquartile Range (IQR) | 6.6% | 3.6% |
| Standard Deviation (Sample) | 4.7% | 3.0% |
| Standard Deviation (Population) | 4.6% | 2.9% |
Similar Demographics by 1 or more Vehicles in Household
Demographics Similar to Estonians by 1 or more Vehicles in Household
In terms of 1 or more vehicles in household, the demographic groups most similar to Estonians are Sudanese (90.3%, a difference of 0.010%), Latvian (90.3%, a difference of 0.020%), Syrian (90.3%, a difference of 0.020%), Hungarian (90.3%, a difference of 0.030%), and Kenyan (90.4%, a difference of 0.040%).
| Demographics | Rating | Rank | 1 or more Vehicles in Household |
| Immigrants | South Africa | 88.1 /100 | #132 | Excellent 90.4% |
| Immigrants | Syria | 87.5 /100 | #133 | Excellent 90.4% |
| Kenyans | 87.0 /100 | #134 | Excellent 90.4% |
| Immigrants | Oceania | 86.9 /100 | #135 | Excellent 90.4% |
| Hungarians | 86.5 /100 | #136 | Excellent 90.3% |
| Latvians | 86.3 /100 | #137 | Excellent 90.3% |
| Syrians | 86.3 /100 | #138 | Excellent 90.3% |
| Estonians | 85.6 /100 | #139 | Excellent 90.3% |
| Sudanese | 85.2 /100 | #140 | Excellent 90.3% |
| Immigrants | Moldova | 83.1 /100 | #141 | Excellent 90.2% |
| Immigrants | Lithuania | 83.0 /100 | #142 | Excellent 90.2% |
| Immigrants | Bahamas | 81.5 /100 | #143 | Excellent 90.2% |
| Immigrants | Zimbabwe | 81.5 /100 | #144 | Excellent 90.2% |
| Sioux | 81.3 /100 | #145 | Excellent 90.2% |
| Bahamians | 80.5 /100 | #146 | Excellent 90.2% |
Demographics Similar to Immigrants from Vietnam by 1 or more Vehicles in Household
In terms of 1 or more vehicles in household, the demographic groups most similar to Immigrants from Vietnam are French Canadian (92.3%, a difference of 0.0%), Malaysian (92.3%, a difference of 0.010%), Swiss (92.3%, a difference of 0.010%), Creek (92.3%, a difference of 0.010%), and Italian (92.3%, a difference of 0.020%).
| Demographics | Rating | Rank | 1 or more Vehicles in Household |
| Samoans | 100.0 /100 | #31 | Exceptional 92.4% |
| Basques | 100.0 /100 | #32 | Exceptional 92.4% |
| Cherokee | 100.0 /100 | #33 | Exceptional 92.4% |
| Italians | 99.9 /100 | #34 | Exceptional 92.3% |
| Czechoslovakians | 99.9 /100 | #35 | Exceptional 92.3% |
| Malaysians | 99.9 /100 | #36 | Exceptional 92.3% |
| French Canadians | 99.9 /100 | #37 | Exceptional 92.3% |
| Immigrants | Vietnam | 99.9 /100 | #38 | Exceptional 92.3% |
| Swiss | 99.9 /100 | #39 | Exceptional 92.3% |
| Creek | 99.9 /100 | #40 | Exceptional 92.3% |
| Immigrants | Taiwan | 99.9 /100 | #41 | Exceptional 92.3% |
| Chickasaw | 99.9 /100 | #42 | Exceptional 92.3% |
| Spanish | 99.9 /100 | #43 | Exceptional 92.3% |
| Choctaw | 99.9 /100 | #44 | Exceptional 92.2% |
| Immigrants | Nonimmigrants | 99.9 /100 | #45 | Exceptional 92.2% |