Immigrants from Hong Kong vs Brazilian 1 or more Vehicles in Household
COMPARE
Immigrants from Hong Kong
Brazilian
1 or more Vehicles in Household
1 or more Vehicles in Household Comparison
Immigrants from Hong Kong
Brazilians
88.7%
1 OR MORE VEHICLES IN HOUSEHOLD
6.2/ 100
METRIC RATING
224th/ 347
METRIC RANK
90.0%
1 OR MORE VEHICLES IN HOUSEHOLD
71.0/ 100
METRIC RATING
158th/ 347
METRIC RANK
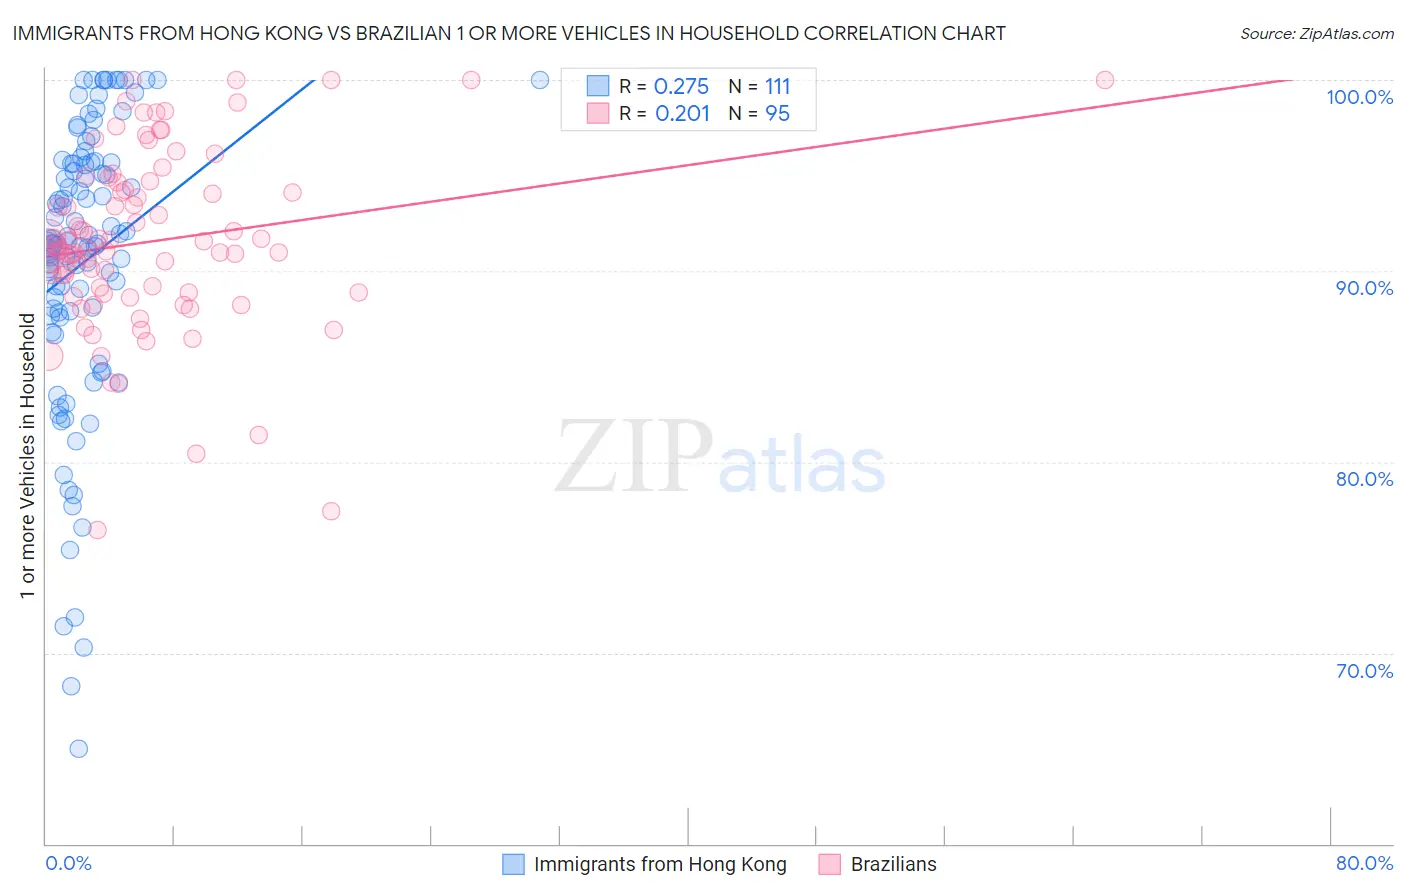
Immigrants from Hong Kong vs Brazilian 1 or more Vehicles in Household Correlation Chart
The statistical analysis conducted on geographies consisting of 243,312,585 people shows a weak positive correlation between the proportion of Immigrants from Hong Kong and percentage of households with 1 or more vehicles available in the United States with a correlation coefficient (R) of 0.275 and weighted average of 88.7%. Similarly, the statistical analysis conducted on geographies consisting of 323,363,062 people shows a weak positive correlation between the proportion of Brazilians and percentage of households with 1 or more vehicles available in the United States with a correlation coefficient (R) of 0.201 and weighted average of 90.0%, a difference of 1.4%.
1 or more Vehicles in Household Correlation Summary
| Measurement | Immigrants from Hong Kong | Brazilian |
| Minimum | 65.0% | 76.4% |
| Maximum | 100.0% | 100.0% |
| Range | 35.0% | 23.6% |
| Mean | 90.5% | 91.5% |
| Median | 91.4% | 91.1% |
| Interquartile 25% (IQ1) | 87.7% | 88.8% |
| Interquartile 75% (IQ3) | 95.7% | 94.6% |
| Interquartile Range (IQR) | 8.0% | 5.8% |
| Standard Deviation (Sample) | 7.5% | 4.7% |
| Standard Deviation (Population) | 7.5% | 4.7% |
Similar Demographics by 1 or more Vehicles in Household
Demographics Similar to Immigrants from Hong Kong by 1 or more Vehicles in Household
In terms of 1 or more vehicles in household, the demographic groups most similar to Immigrants from Hong Kong are Cree (88.7%, a difference of 0.010%), Cheyenne (88.7%, a difference of 0.040%), Ute (88.7%, a difference of 0.040%), Uruguayan (88.8%, a difference of 0.050%), and Immigrants from South America (88.8%, a difference of 0.050%).
| Demographics | Rating | Rank | 1 or more Vehicles in Household |
| Argentineans | 8.8 /100 | #217 | Tragic 88.9% |
| Ugandans | 8.7 /100 | #218 | Tragic 88.9% |
| Immigrants | Guatemala | 8.6 /100 | #219 | Tragic 88.9% |
| Immigrants | Zaire | 8.1 /100 | #220 | Tragic 88.8% |
| Peruvians | 7.9 /100 | #221 | Tragic 88.8% |
| Uruguayans | 7.0 /100 | #222 | Tragic 88.8% |
| Immigrants | South America | 7.0 /100 | #223 | Tragic 88.8% |
| Immigrants | Hong Kong | 6.2 /100 | #224 | Tragic 88.7% |
| Cree | 6.0 /100 | #225 | Tragic 88.7% |
| Cheyenne | 5.7 /100 | #226 | Tragic 88.7% |
| Ute | 5.6 /100 | #227 | Tragic 88.7% |
| Immigrants | Norway | 5.5 /100 | #228 | Tragic 88.7% |
| Immigrants | Romania | 5.4 /100 | #229 | Tragic 88.7% |
| Immigrants | Sierra Leone | 5.2 /100 | #230 | Tragic 88.7% |
| Russians | 5.0 /100 | #231 | Tragic 88.7% |
Demographics Similar to Brazilians by 1 or more Vehicles in Household
In terms of 1 or more vehicles in household, the demographic groups most similar to Brazilians are Immigrants from Congo (90.0%, a difference of 0.0%), South African (90.0%, a difference of 0.020%), Australian (90.0%, a difference of 0.030%), Immigrants from Indonesia (90.0%, a difference of 0.040%), and Salvadoran (90.0%, a difference of 0.040%).
| Demographics | Rating | Rank | 1 or more Vehicles in Household |
| Immigrants | Bosnia and Herzegovina | 75.4 /100 | #151 | Good 90.1% |
| Tlingit-Haida | 74.3 /100 | #152 | Good 90.1% |
| New Zealanders | 73.8 /100 | #153 | Good 90.1% |
| Immigrants | Uganda | 73.8 /100 | #154 | Good 90.1% |
| Immigrants | Immigrants | 73.6 /100 | #155 | Good 90.1% |
| Australians | 72.4 /100 | #156 | Good 90.0% |
| Immigrants | Congo | 71.2 /100 | #157 | Good 90.0% |
| Brazilians | 71.0 /100 | #158 | Good 90.0% |
| South Africans | 69.7 /100 | #159 | Good 90.0% |
| Immigrants | Indonesia | 68.8 /100 | #160 | Good 90.0% |
| Salvadorans | 68.7 /100 | #161 | Good 90.0% |
| Spanish American Indians | 67.0 /100 | #162 | Good 89.9% |
| Immigrants | Austria | 65.5 /100 | #163 | Good 89.9% |
| Comanche | 63.4 /100 | #164 | Good 89.9% |
| Immigrants | Saudi Arabia | 62.6 /100 | #165 | Good 89.9% |