Immigrants from Eritrea vs Brazilian 1 or more Vehicles in Household
COMPARE
Immigrants from Eritrea
Brazilian
1 or more Vehicles in Household
1 or more Vehicles in Household Comparison
Immigrants from Eritrea
Brazilians
89.4%
1 OR MORE VEHICLES IN HOUSEHOLD
33.2/ 100
METRIC RATING
194th/ 347
METRIC RANK
90.0%
1 OR MORE VEHICLES IN HOUSEHOLD
71.0/ 100
METRIC RATING
158th/ 347
METRIC RANK
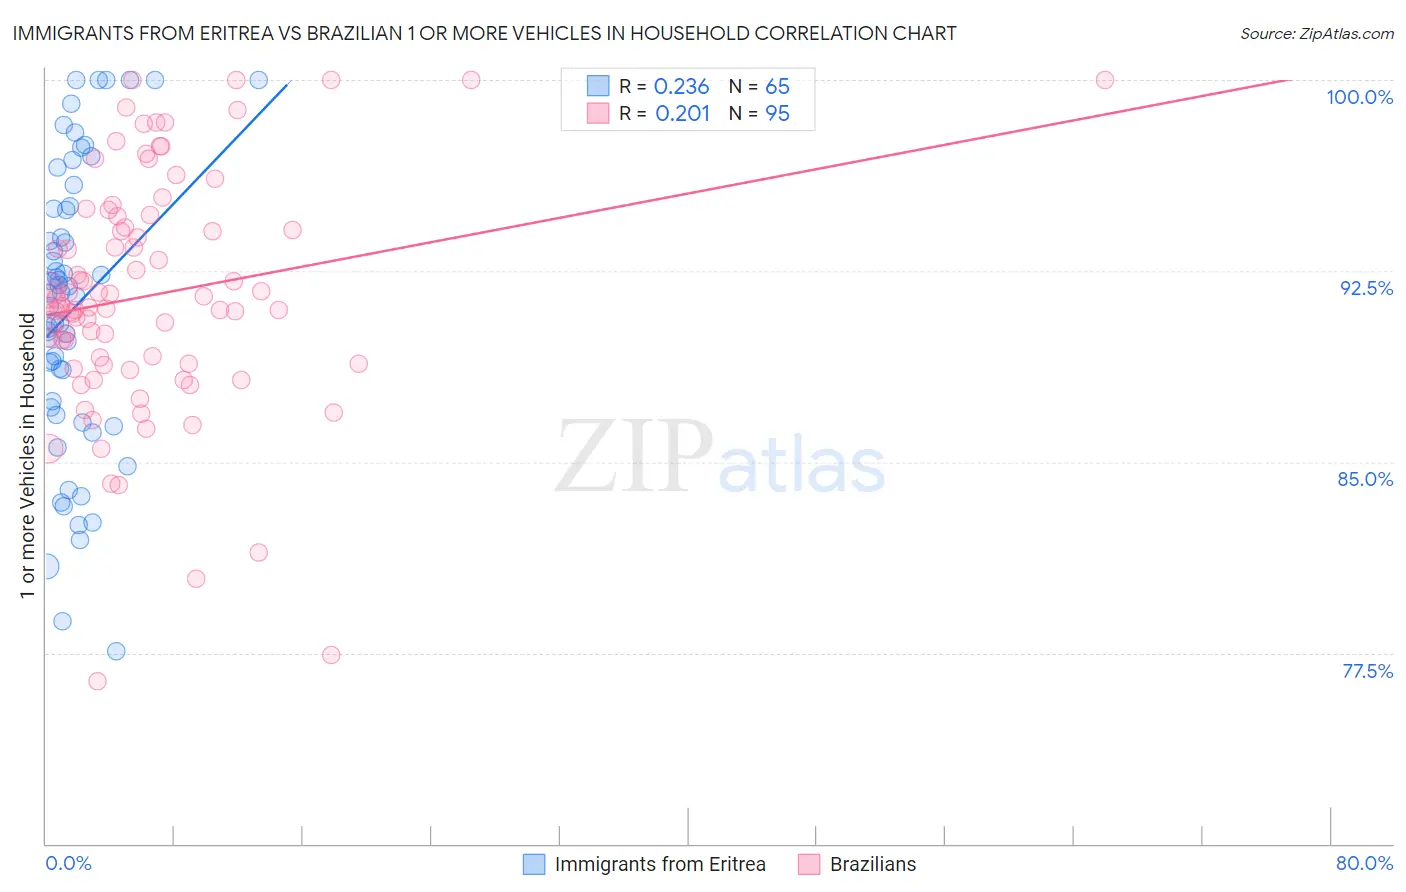
Immigrants from Eritrea vs Brazilian 1 or more Vehicles in Household Correlation Chart
The statistical analysis conducted on geographies consisting of 104,847,164 people shows a weak positive correlation between the proportion of Immigrants from Eritrea and percentage of households with 1 or more vehicles available in the United States with a correlation coefficient (R) of 0.236 and weighted average of 89.4%. Similarly, the statistical analysis conducted on geographies consisting of 323,363,062 people shows a weak positive correlation between the proportion of Brazilians and percentage of households with 1 or more vehicles available in the United States with a correlation coefficient (R) of 0.201 and weighted average of 90.0%, a difference of 0.62%.
1 or more Vehicles in Household Correlation Summary
| Measurement | Immigrants from Eritrea | Brazilian |
| Minimum | 77.6% | 76.4% |
| Maximum | 100.0% | 100.0% |
| Range | 22.4% | 23.6% |
| Mean | 91.0% | 91.5% |
| Median | 91.6% | 91.1% |
| Interquartile 25% (IQ1) | 87.0% | 88.8% |
| Interquartile 75% (IQ3) | 95.0% | 94.6% |
| Interquartile Range (IQR) | 8.0% | 5.8% |
| Standard Deviation (Sample) | 5.6% | 4.7% |
| Standard Deviation (Population) | 5.6% | 4.7% |
Similar Demographics by 1 or more Vehicles in Household
Demographics Similar to Immigrants from Eritrea by 1 or more Vehicles in Household
In terms of 1 or more vehicles in household, the demographic groups most similar to Immigrants from Eritrea are Immigrants from Armenia (89.4%, a difference of 0.020%), Immigrants from Northern Europe (89.5%, a difference of 0.040%), Immigrants from North Macedonia (89.5%, a difference of 0.060%), Shoshone (89.5%, a difference of 0.070%), and Immigrants from Poland (89.5%, a difference of 0.070%).
| Demographics | Rating | Rank | 1 or more Vehicles in Household |
| South Americans | 39.6 /100 | #187 | Fair 89.5% |
| Immigrants | Nepal | 38.9 /100 | #188 | Fair 89.5% |
| Carpatho Rusyns | 37.8 /100 | #189 | Fair 89.5% |
| Shoshone | 37.5 /100 | #190 | Fair 89.5% |
| Immigrants | Poland | 37.1 /100 | #191 | Fair 89.5% |
| Immigrants | North Macedonia | 36.5 /100 | #192 | Fair 89.5% |
| Immigrants | Northern Europe | 35.5 /100 | #193 | Fair 89.5% |
| Immigrants | Eritrea | 33.2 /100 | #194 | Fair 89.4% |
| Immigrants | Armenia | 31.8 /100 | #195 | Fair 89.4% |
| Crow | 24.3 /100 | #196 | Fair 89.3% |
| Immigrants | Sweden | 23.6 /100 | #197 | Fair 89.3% |
| Pennsylvania Germans | 22.9 /100 | #198 | Fair 89.3% |
| Immigrants | Asia | 22.8 /100 | #199 | Fair 89.3% |
| Central Americans | 21.4 /100 | #200 | Fair 89.2% |
| Immigrants | Western Europe | 20.5 /100 | #201 | Fair 89.2% |
Demographics Similar to Brazilians by 1 or more Vehicles in Household
In terms of 1 or more vehicles in household, the demographic groups most similar to Brazilians are Immigrants from Congo (90.0%, a difference of 0.0%), South African (90.0%, a difference of 0.020%), Australian (90.0%, a difference of 0.030%), Immigrants from Indonesia (90.0%, a difference of 0.040%), and Salvadoran (90.0%, a difference of 0.040%).
| Demographics | Rating | Rank | 1 or more Vehicles in Household |
| Immigrants | Bosnia and Herzegovina | 75.4 /100 | #151 | Good 90.1% |
| Tlingit-Haida | 74.3 /100 | #152 | Good 90.1% |
| New Zealanders | 73.8 /100 | #153 | Good 90.1% |
| Immigrants | Uganda | 73.8 /100 | #154 | Good 90.1% |
| Immigrants | Immigrants | 73.6 /100 | #155 | Good 90.1% |
| Australians | 72.4 /100 | #156 | Good 90.0% |
| Immigrants | Congo | 71.2 /100 | #157 | Good 90.0% |
| Brazilians | 71.0 /100 | #158 | Good 90.0% |
| South Africans | 69.7 /100 | #159 | Good 90.0% |
| Immigrants | Indonesia | 68.8 /100 | #160 | Good 90.0% |
| Salvadorans | 68.7 /100 | #161 | Good 90.0% |
| Spanish American Indians | 67.0 /100 | #162 | Good 89.9% |
| Immigrants | Austria | 65.5 /100 | #163 | Good 89.9% |
| Comanche | 63.4 /100 | #164 | Good 89.9% |
| Immigrants | Saudi Arabia | 62.6 /100 | #165 | Good 89.9% |