Ecuadorian vs Immigrants from Norway Family Households with Children

COMPARE

Ecuadorian
Race
Ancestry
AfghanAfricanAlaska NativeAlaskan AthabascanAlbanianAleutAlsatianAmericanApacheArabArapahoArgentineanArmenianAssyrian/Chaldean/SyriacAustralianAustrianBahamianBangladeshiBarbadianBasqueBelgianBelizeanBermudanBhutaneseBlackfeetBolivianBrazilianBritishBritish West IndianBulgarianBurmeseCajunCambodianCanadianCape VerdeanCarpatho RusynCelticCentral AmericanCentral American IndianCherokeeCheyenneChickasawChileanChineseChippewaChoctawColombianColvilleComancheCosta RicanCreeCreekCroatianCrowCubanCypriotCzechCzechoslovakianDanishDelawareDominicanDutchDutch West IndianEastern EuropeanEcuadorianEgyptianEnglishEstonianEthiopianEuropeanFijianFilipinoFinnishFrenchFrench American IndianFrench CanadianGermanGerman RussianGhanaianGreekGuamanian/ChamorroGuatemalanGuyaneseHaitianHmongHonduranHopiHoumaHungarianIcelanderIndian (Asian)IndonesianInupiatIranianIraqiIrishIroquoisIsraeliItalianJamaicanJapaneseJordanianKenyanKiowaKoreanLaotianLatvianLebaneseLiberianLithuanianLumbeeLuxembourgerMacedonianMalaysianMalteseMarshalleseMenomineeMexicanMexican American IndianMongolianMoroccanNative HawaiianNavajoNepaleseNew ZealanderNicaraguanNigerianNorthern EuropeanNorwegianOkinawanOsageOttawaPaiutePakistaniPalestinianPanamanianParaguayanPennsylvania GermanPeruvianPimaPolishPortuguesePotawatomiPuebloPuerto RicanPuget Sound SalishRomanianRussianSalvadoranSamoanScandinavianScotch-IrishScottishSeminoleSenegaleseSerbianShoshoneSierra LeoneanSiouxSlavicSlovakSloveneSomaliSouth AfricanSouth AmericanSouth American IndianSoviet UnionSpaniardSpanishSpanish AmericanSpanish American IndianSri LankanSubsaharan AfricanSudaneseSwedishSwissSyrianTaiwaneseThaiTlingit-HaidaTohono O'OdhamTonganTrinidadian and TobagonianTsimshianTurkishU.S. Virgin IslanderUgandanUkrainianUruguayanUteVenezuelanVietnameseWelshWest IndianYakamaYaquiYugoslavianYumanYup'ikZimbabwean
Immigration
NonimmigrantsImmigrantsAfghanistanAfricaAlbaniaArgentinaArmeniaAsiaAustraliaAustriaBahamasBangladeshBarbadosBelarusBelgiumBelizeBoliviaBosnia and HerzegovinaBrazilBulgariaBurma/MyanmarCabo VerdeCambodiaCameroonCanadaCaribbeanCentral AmericaChileChinaColombiaCongoCosta RicaCroatiaCubaCzechoslovakiaDenmarkDominicaDominican RepublicEastern AfricaEastern AsiaEastern EuropeEcuadorEgyptEl SalvadorEnglandEritreaEthiopiaEuropeFijiFranceGermanyGhanaGreeceGrenadaGuatemalaGuyanaHaitiHondurasHong KongHungaryIndiaIndonesiaIranIraqIrelandIsraelItalyJamaicaJapanJordanKazakhstanKenyaKoreaKuwaitLaosLatin AmericaLatviaLebanonLiberiaLithuaniaMalaysiaMexicoMicronesiaMiddle AfricaMoldovaMoroccoNepalNetherlandsNicaraguaNigeriaNorth AmericaNorth MacedoniaNorthern AfricaNorthern EuropeOceaniaPakistanPanamaPeruPhilippinesPolandPortugalRomaniaRussiaSaudi ArabiaScotlandSenegalSerbiaSierra LeoneSingaporeSomaliaSouth AfricaSouth AmericaSouth Central AsiaSouth Eastern AsiaSouthern EuropeSpainSri LankaSt. Vincent and the GrenadinesSudanSwedenSwitzerlandSyriaTaiwanThailandTrinidad and TobagoTurkeyUgandaUkraineUruguayUzbekistanVenezuelaVietnamWest IndiesWestern AfricaWestern AsiaWestern EuropeYemenZaireZimbabweAzores
Immigrants from Norway
Race
Ancestry
AfghanAfricanAlaska NativeAlaskan AthabascanAlbanianAleutAlsatianAmericanApacheArabArapahoArgentineanArmenianAssyrian/Chaldean/SyriacAustralianAustrianBahamianBangladeshiBarbadianBasqueBelgianBelizeanBermudanBhutaneseBlackfeetBolivianBrazilianBritishBritish West IndianBulgarianBurmeseCajunCambodianCanadianCape VerdeanCarpatho RusynCelticCentral AmericanCentral American IndianCherokeeCheyenneChickasawChileanChineseChippewaChoctawColombianColvilleComancheCosta RicanCreeCreekCroatianCrowCubanCypriotCzechCzechoslovakianDanishDelawareDominicanDutchDutch West IndianEastern EuropeanEgyptianEnglishEstonianEthiopianEuropeanFijianFilipinoFinnishFrenchFrench American IndianFrench CanadianGermanGerman RussianGhanaianGreekGuamanian/ChamorroGuatemalanGuyaneseHaitianHmongHonduranHopiHoumaHungarianIcelanderIndian (Asian)IndonesianInupiatIranianIraqiIrishIroquoisIsraeliItalianJamaicanJapaneseJordanianKenyanKiowaKoreanLaotianLatvianLebaneseLiberianLithuanianLumbeeLuxembourgerMacedonianMalaysianMalteseMarshalleseMenomineeMexicanMexican American IndianMongolianMoroccanNative HawaiianNavajoNepaleseNew ZealanderNicaraguanNigerianNorthern EuropeanNorwegianOkinawanOsageOttawaPaiutePakistaniPalestinianPanamanianParaguayanPennsylvania GermanPeruvianPimaPolishPortuguesePotawatomiPuebloPuerto RicanPuget Sound SalishRomanianRussianSalvadoranSamoanScandinavianScotch-IrishScottishSeminoleSenegaleseSerbianShoshoneSierra LeoneanSiouxSlavicSlovakSloveneSomaliSouth AfricanSouth AmericanSouth American IndianSoviet UnionSpaniardSpanishSpanish AmericanSpanish American IndianSri LankanSubsaharan AfricanSudaneseSwedishSwissSyrianTaiwaneseThaiTlingit-HaidaTohono O'OdhamTonganTrinidadian and TobagonianTsimshianTurkishU.S. Virgin IslanderUgandanUkrainianUruguayanUteVenezuelanVietnameseWelshWest IndianYakamaYaquiYugoslavianYumanYup'ikZimbabwean
Immigration
NonimmigrantsImmigrantsAfghanistanAfricaAlbaniaArgentinaArmeniaAsiaAustraliaAustriaBahamasBangladeshBarbadosBelarusBelgiumBelizeBoliviaBosnia and HerzegovinaBrazilBulgariaBurma/MyanmarCabo VerdeCambodiaCameroonCanadaCaribbeanCentral AmericaChileChinaColombiaCongoCosta RicaCroatiaCubaCzechoslovakiaDenmarkDominicaDominican RepublicEastern AfricaEastern AsiaEastern EuropeEcuadorEgyptEl SalvadorEnglandEritreaEthiopiaEuropeFijiFranceGermanyGhanaGreeceGrenadaGuatemalaGuyanaHaitiHondurasHong KongHungaryIndiaIndonesiaIranIraqIrelandIsraelItalyJamaicaJapanJordanKazakhstanKenyaKoreaKuwaitLaosLatin AmericaLatviaLebanonLiberiaLithuaniaMalaysiaMexicoMicronesiaMiddle AfricaMoldovaMoroccoNepalNetherlandsNicaraguaNigeriaNorth AmericaNorth MacedoniaNorthern AfricaNorthern EuropeNorwayOceaniaPakistanPanamaPeruPhilippinesPolandPortugalRomaniaRussiaSaudi ArabiaScotlandSenegalSerbiaSierra LeoneSingaporeSomaliaSouth AfricaSouth AmericaSouth Central AsiaSouth Eastern AsiaSouthern EuropeSpainSri LankaSt. Vincent and the GrenadinesSudanSwedenSwitzerlandSyriaTaiwanThailandTrinidad and TobagoTurkeyUgandaUkraineUruguayUzbekistanVenezuelaVietnamWest IndiesWestern AfricaWestern AsiaWestern EuropeYemenZaireZimbabweAzores
Family Households with Children
Income
Poverty
Unemployment
Labor Participation
Family Structure
Vehicle Availability
Education Level
Disability

Family Households with Children Comparison

Ecuadorians

Immigrants from Norway

Exceptional
Tragic
27.8%
FAMILY HOUSEHOLDS WITH CHILDREN
90.8/ 100
METRIC RATING
125th/ 347
METRIC RANK
26.1%
FAMILY HOUSEHOLDS WITH CHILDREN
0.0/ 100
METRIC RATING
315th/ 347
METRIC RANK

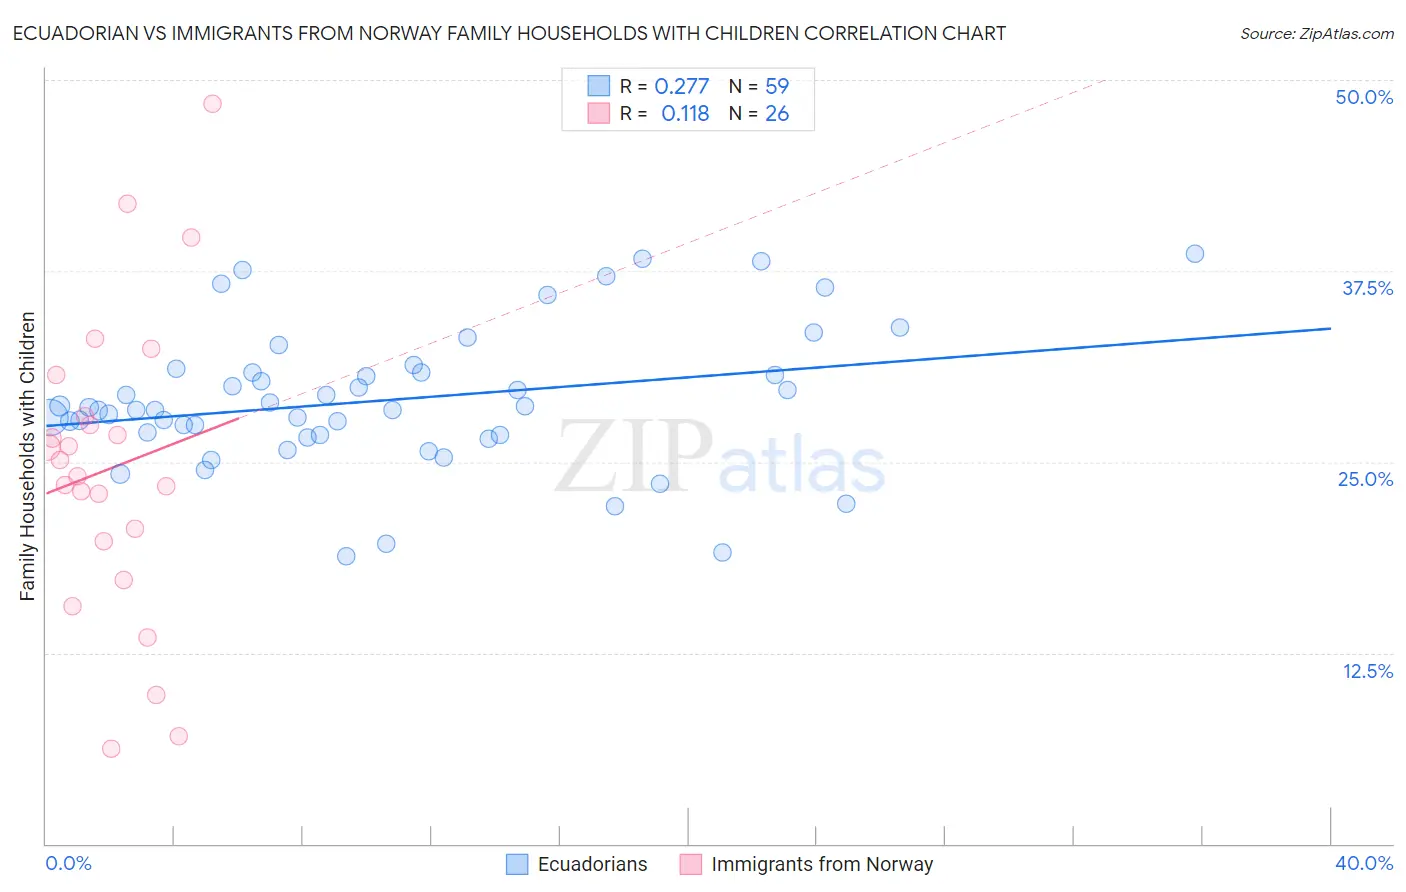
Ecuadorian vs Immigrants from Norway Family Households with Children Correlation Chart

The statistical analysis conducted on geographies consisting of 317,541,400 people shows a weak positive correlation between the proportion of Ecuadorians and percentage of family households with children in the United States with a correlation coefficient (R) of 0.277 and weighted average of 27.8%. Similarly, the statistical analysis conducted on geographies consisting of 116,684,213 people shows a poor positive correlation between the proportion of Immigrants from Norway and percentage of family households with children in the United States with a correlation coefficient (R) of 0.118 and weighted average of 26.1%, a difference of 6.4%.
Ecuadorian vs Immigrants from Norway Family Households with Children

Family Households with Children Correlation Summary

MeasurementEcuadorianImmigrants from Norway
Minimum18.8%6.2%
Maximum38.7%48.4%
Range19.9%42.2%
Mean29.0%24.6%
Median28.4%24.6%
Interquartile 25% (IQ1)26.7%19.8%
Interquartile 75% (IQ3)30.9%28.0%
Interquartile Range (IQR)4.1%8.1%
Standard Deviation (Sample)4.6%9.9%
Standard Deviation (Population)4.5%9.7%

Similar Demographics by Family Households with Children

Demographics Similar to Ecuadorians by Family Households with Children

In terms of family households with children, the demographic groups most similar to Ecuadorians are Immigrants from Singapore (27.8%, a difference of 0.0%), Immigrants from Ethiopia (27.8%, a difference of 0.020%), Belizean (27.8%, a difference of 0.050%), Immigrants from Northern Africa (27.8%, a difference of 0.070%), and Syrian (27.8%, a difference of 0.070%).
DemographicsRating | RankFamily Households with Children
Central American Indians
95.9
/100
|
#118
Exceptional
27.9%
Zimbabweans
95.6
/100
|
#119
Exceptional
27.9%
Europeans
95.4
/100
|
#120
Exceptional
27.9%
Immigrants | Western Asia
93.6
/100
|
#121
Exceptional
27.9%
Immigrants | Zimbabwe
92.8
/100
|
#122
Exceptional
27.8%
Immigrants | Northern Africa
91.8
/100
|
#123
Exceptional
27.8%
Immigrants | Singapore
90.8
/100
|
#124
Exceptional
27.8%
Ecuadorians
90.8
/100
|
#125
Exceptional
27.8%
Immigrants | Ethiopia
90.5
/100
|
#126
Exceptional
27.8%
Belizeans
90.0
/100
|
#127
Exceptional
27.8%
Syrians
89.7
/100
|
#128
Excellent
27.8%
Immigrants | Eritrea
89.4
/100
|
#129
Excellent
27.8%
Cajuns
87.6
/100
|
#130
Excellent
27.7%
Lebanese
87.4
/100
|
#131
Excellent
27.7%
Immigrants | Belize
85.7
/100
|
#132
Excellent
27.7%

Demographics Similar to Immigrants from Norway by Family Households with Children

In terms of family households with children, the demographic groups most similar to Immigrants from Norway are French Canadian (26.1%, a difference of 0.070%), Estonian (26.1%, a difference of 0.080%), Cree (26.2%, a difference of 0.15%), Ottawa (26.1%, a difference of 0.17%), and Iroquois (26.1%, a difference of 0.21%).
DemographicsRating | RankFamily Households with Children
Lumbee
0.0
/100
|
#308
Tragic
26.3%
Immigrants | Somalia
0.0
/100
|
#309
Tragic
26.3%
Marshallese
0.0
/100
|
#310
Tragic
26.2%
Colville
0.0
/100
|
#311
Tragic
26.2%
Immigrants | Czechoslovakia
0.0
/100
|
#312
Tragic
26.2%
Cree
0.0
/100
|
#313
Tragic
26.2%
French Canadians
0.0
/100
|
#314
Tragic
26.1%
Immigrants | Norway
0.0
/100
|
#315
Tragic
26.1%
Estonians
0.0
/100
|
#316
Tragic
26.1%
Ottawa
0.0
/100
|
#317
Tragic
26.1%
Iroquois
0.0
/100
|
#318
Tragic
26.1%
Immigrants | France
0.0
/100
|
#319
Tragic
26.0%
Tlingit-Haida
0.0
/100
|
#320
Tragic
26.0%
British West Indians
0.0
/100
|
#321
Tragic
26.0%
Immigrants | Greece
0.0
/100
|
#322
Tragic
26.0%