Dutch vs Immigrants from Middle Africa 1 or more Vehicles in Household
COMPARE
Dutch
Immigrants from Middle Africa
1 or more Vehicles in Household
1 or more Vehicles in Household Comparison
Dutch
Immigrants from Middle Africa
93.3%
1 OR MORE VEHICLES IN HOUSEHOLD
100.0/ 100
METRIC RATING
10th/ 347
METRIC RANK
89.9%
1 OR MORE VEHICLES IN HOUSEHOLD
62.2/ 100
METRIC RATING
166th/ 347
METRIC RANK
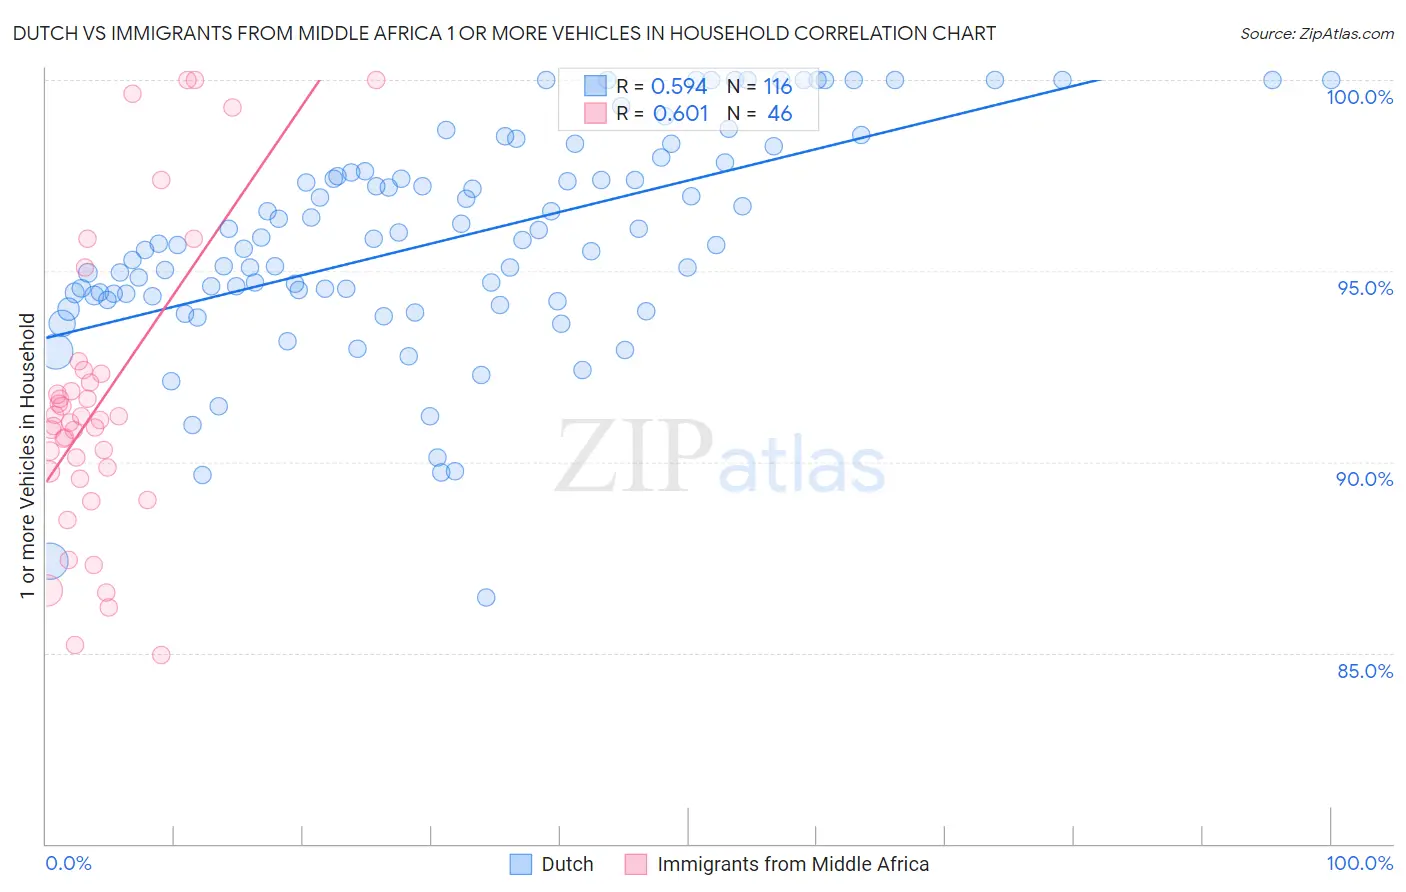
Dutch vs Immigrants from Middle Africa 1 or more Vehicles in Household Correlation Chart
The statistical analysis conducted on geographies consisting of 553,951,322 people shows a substantial positive correlation between the proportion of Dutch and percentage of households with 1 or more vehicles available in the United States with a correlation coefficient (R) of 0.594 and weighted average of 93.3%. Similarly, the statistical analysis conducted on geographies consisting of 202,674,043 people shows a significant positive correlation between the proportion of Immigrants from Middle Africa and percentage of households with 1 or more vehicles available in the United States with a correlation coefficient (R) of 0.601 and weighted average of 89.9%, a difference of 3.8%.
1 or more Vehicles in Household Correlation Summary
| Measurement | Dutch | Immigrants from Middle Africa |
| Minimum | 86.4% | 85.0% |
| Maximum | 100.0% | 100.0% |
| Range | 13.6% | 15.0% |
| Mean | 95.8% | 91.6% |
| Median | 95.7% | 91.1% |
| Interquartile 25% (IQ1) | 94.3% | 89.7% |
| Interquartile 75% (IQ3) | 97.6% | 92.3% |
| Interquartile Range (IQR) | 3.2% | 2.5% |
| Standard Deviation (Sample) | 2.8% | 3.8% |
| Standard Deviation (Population) | 2.8% | 3.8% |
Similar Demographics by 1 or more Vehicles in Household
Demographics Similar to Dutch by 1 or more Vehicles in Household
In terms of 1 or more vehicles in household, the demographic groups most similar to Dutch are Scotch-Irish (93.3%, a difference of 0.030%), Czech (93.3%, a difference of 0.030%), Swedish (93.3%, a difference of 0.040%), Scottish (93.4%, a difference of 0.080%), and Scandinavian (93.1%, a difference of 0.19%).
| Demographics | Rating | Rank | 1 or more Vehicles in Household |
| Norwegians | 100.0 /100 | #3 | Exceptional 93.7% |
| Germans | 100.0 /100 | #4 | Exceptional 93.6% |
| Yakama | 100.0 /100 | #5 | Exceptional 93.6% |
| Danes | 100.0 /100 | #6 | Exceptional 93.5% |
| Scottish | 100.0 /100 | #7 | Exceptional 93.4% |
| Swedes | 100.0 /100 | #8 | Exceptional 93.3% |
| Scotch-Irish | 100.0 /100 | #9 | Exceptional 93.3% |
| Dutch | 100.0 /100 | #10 | Exceptional 93.3% |
| Czechs | 100.0 /100 | #11 | Exceptional 93.3% |
| Scandinavians | 100.0 /100 | #12 | Exceptional 93.1% |
| Whites/Caucasians | 100.0 /100 | #13 | Exceptional 93.1% |
| Irish | 100.0 /100 | #14 | Exceptional 93.1% |
| Mexicans | 100.0 /100 | #15 | Exceptional 93.0% |
| Assyrians/Chaldeans/Syriacs | 100.0 /100 | #16 | Exceptional 93.0% |
| Europeans | 100.0 /100 | #17 | Exceptional 93.0% |
Demographics Similar to Immigrants from Middle Africa by 1 or more Vehicles in Household
In terms of 1 or more vehicles in household, the demographic groups most similar to Immigrants from Middle Africa are Immigrants from Saudi Arabia (89.9%, a difference of 0.010%), Comanche (89.9%, a difference of 0.020%), Immigrants from Latin America (89.8%, a difference of 0.030%), Immigrants from Cambodia (89.8%, a difference of 0.040%), and Native/Alaskan (89.8%, a difference of 0.040%).
| Demographics | Rating | Rank | 1 or more Vehicles in Household |
| South Africans | 69.7 /100 | #159 | Good 90.0% |
| Immigrants | Indonesia | 68.8 /100 | #160 | Good 90.0% |
| Salvadorans | 68.7 /100 | #161 | Good 90.0% |
| Spanish American Indians | 67.0 /100 | #162 | Good 89.9% |
| Immigrants | Austria | 65.5 /100 | #163 | Good 89.9% |
| Comanche | 63.4 /100 | #164 | Good 89.9% |
| Immigrants | Saudi Arabia | 62.6 /100 | #165 | Good 89.9% |
| Immigrants | Middle Africa | 62.2 /100 | #166 | Good 89.9% |
| Immigrants | Latin America | 60.3 /100 | #167 | Good 89.8% |
| Immigrants | Cambodia | 60.1 /100 | #168 | Good 89.8% |
| Natives/Alaskans | 59.5 /100 | #169 | Average 89.8% |
| Immigrants | Costa Rica | 57.6 /100 | #170 | Average 89.8% |
| French American Indians | 54.4 /100 | #171 | Average 89.8% |
| Indonesians | 53.0 /100 | #172 | Average 89.7% |
| Lumbee | 52.8 /100 | #173 | Average 89.7% |