Dutch vs Guatemalan Disability Age 65 to 74
COMPARE
Dutch
Guatemalan
Disability Age 65 to 74
Disability Age 65 to 74 Comparison
Dutch
Guatemalans
23.3%
DISABILITY AGE 65 TO 74
49.4/ 100
METRIC RATING
175th/ 347
METRIC RANK
25.5%
DISABILITY AGE 65 TO 74
0.2/ 100
METRIC RATING
265th/ 347
METRIC RANK
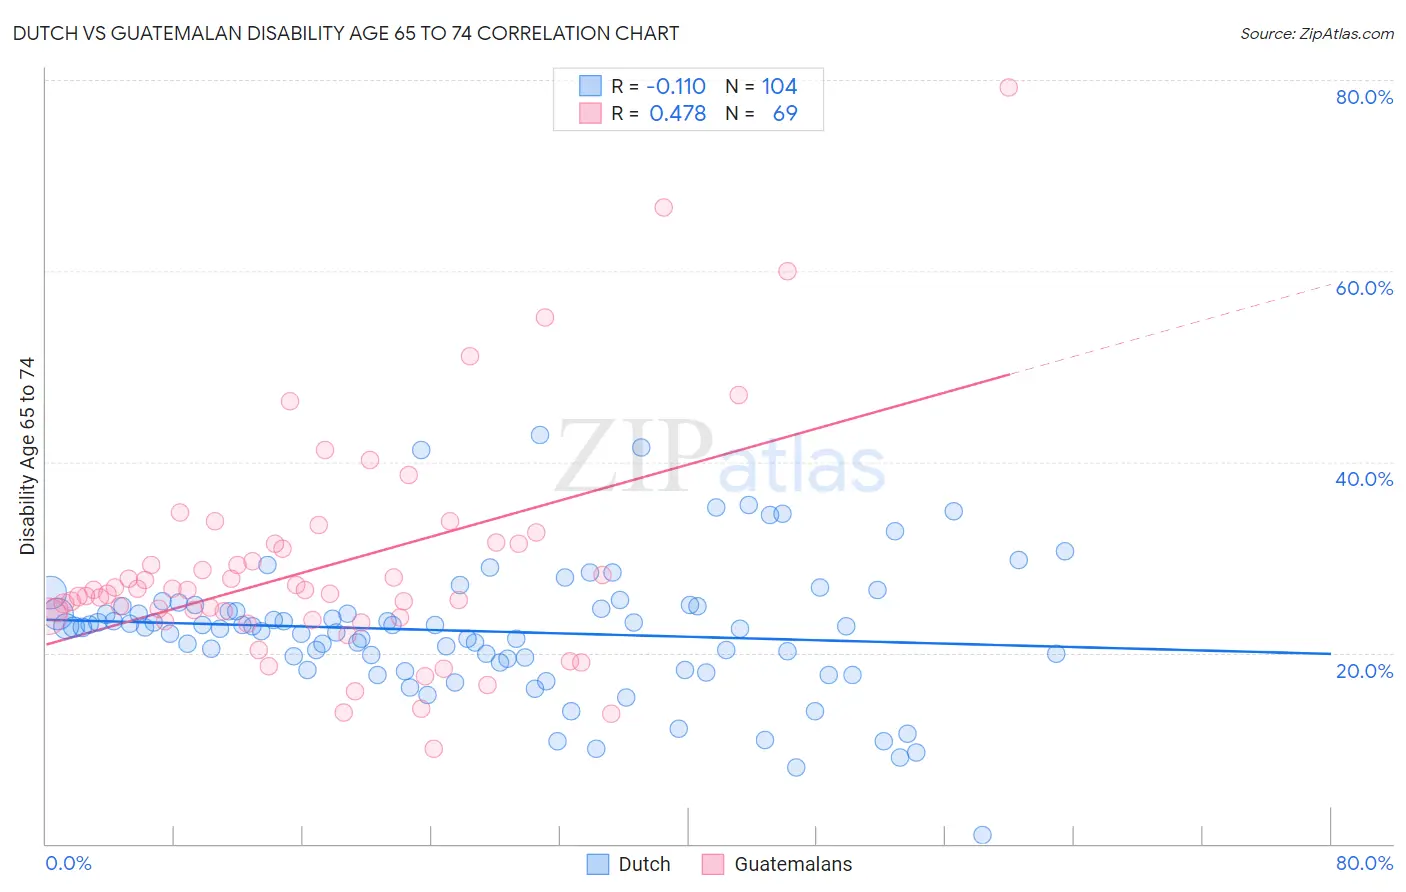
Dutch vs Guatemalan Disability Age 65 to 74 Correlation Chart
The statistical analysis conducted on geographies consisting of 552,341,864 people shows a poor negative correlation between the proportion of Dutch and percentage of population with a disability between the ages 65 and 75 in the United States with a correlation coefficient (R) of -0.110 and weighted average of 23.3%. Similarly, the statistical analysis conducted on geographies consisting of 408,717,949 people shows a moderate positive correlation between the proportion of Guatemalans and percentage of population with a disability between the ages 65 and 75 in the United States with a correlation coefficient (R) of 0.478 and weighted average of 25.5%, a difference of 9.4%.
Disability Age 65 to 74 Correlation Summary
| Measurement | Dutch | Guatemalan |
| Minimum | 0.85% | 10.0% |
| Maximum | 42.9% | 79.2% |
| Range | 42.0% | 69.2% |
| Mean | 22.2% | 29.0% |
| Median | 22.7% | 26.6% |
| Interquartile 25% (IQ1) | 19.2% | 23.6% |
| Interquartile 75% (IQ3) | 24.8% | 31.4% |
| Interquartile Range (IQR) | 5.7% | 7.8% |
| Standard Deviation (Sample) | 6.9% | 11.9% |
| Standard Deviation (Population) | 6.9% | 11.9% |
Similar Demographics by Disability Age 65 to 74
Demographics Similar to Dutch by Disability Age 65 to 74
In terms of disability age 65 to 74, the demographic groups most similar to Dutch are Immigrants from South Eastern Asia (23.3%, a difference of 0.040%), Yugoslavian (23.3%, a difference of 0.050%), German (23.3%, a difference of 0.070%), Immigrants from Eritrea (23.4%, a difference of 0.11%), and Immigrants from Haiti (23.4%, a difference of 0.11%).
| Demographics | Rating | Rank | Disability Age 65 to 74 |
| Pakistanis | 57.0 /100 | #168 | Average 23.2% |
| Icelanders | 54.3 /100 | #169 | Average 23.3% |
| Moroccans | 54.2 /100 | #170 | Average 23.3% |
| Cubans | 51.9 /100 | #171 | Average 23.3% |
| Germans | 50.5 /100 | #172 | Average 23.3% |
| Yugoslavians | 50.2 /100 | #173 | Average 23.3% |
| Immigrants | South Eastern Asia | 50.0 /100 | #174 | Average 23.3% |
| Dutch | 49.4 /100 | #175 | Average 23.3% |
| Immigrants | Eritrea | 47.5 /100 | #176 | Average 23.4% |
| Immigrants | Haiti | 47.5 /100 | #177 | Average 23.4% |
| Guyanese | 45.8 /100 | #178 | Average 23.4% |
| Immigrants | Sierra Leone | 45.8 /100 | #179 | Average 23.4% |
| Scandinavians | 45.6 /100 | #180 | Average 23.4% |
| Assyrians/Chaldeans/Syriacs | 45.3 /100 | #181 | Average 23.4% |
| Irish | 44.4 /100 | #182 | Average 23.4% |
Demographics Similar to Guatemalans by Disability Age 65 to 74
In terms of disability age 65 to 74, the demographic groups most similar to Guatemalans are Hawaiian (25.5%, a difference of 0.050%), Immigrants from Latin America (25.6%, a difference of 0.080%), Ottawa (25.6%, a difference of 0.23%), Liberian (25.6%, a difference of 0.33%), and Iroquois (25.4%, a difference of 0.39%).
| Demographics | Rating | Rank | Disability Age 65 to 74 |
| Marshallese | 0.3 /100 | #258 | Tragic 25.3% |
| Immigrants | Cambodia | 0.3 /100 | #259 | Tragic 25.3% |
| Malaysians | 0.2 /100 | #260 | Tragic 25.4% |
| Cape Verdeans | 0.2 /100 | #261 | Tragic 25.4% |
| Samoans | 0.2 /100 | #262 | Tragic 25.4% |
| Iroquois | 0.2 /100 | #263 | Tragic 25.4% |
| Hawaiians | 0.2 /100 | #264 | Tragic 25.5% |
| Guatemalans | 0.2 /100 | #265 | Tragic 25.5% |
| Immigrants | Latin America | 0.1 /100 | #266 | Tragic 25.6% |
| Ottawa | 0.1 /100 | #267 | Tragic 25.6% |
| Liberians | 0.1 /100 | #268 | Tragic 25.6% |
| Hmong | 0.1 /100 | #269 | Tragic 25.7% |
| Immigrants | Guatemala | 0.1 /100 | #270 | Tragic 25.7% |
| Immigrants | Liberia | 0.1 /100 | #271 | Tragic 25.7% |
| Immigrants | Dominica | 0.1 /100 | #272 | Tragic 25.7% |