German vs Alaska Native No Vehicles in Household
COMPARE
German
Alaska Native
No Vehicles in Household
No Vehicles in Household Comparison
Germans
Alaska Natives
6.7%
NO VEHICLES IN HOUSEHOLD
100.0/ 100
METRIC RATING
6th/ 347
METRIC RANK
17.4%
NO VEHICLES IN HOUSEHOLD
0.0/ 100
METRIC RATING
319th/ 347
METRIC RANK
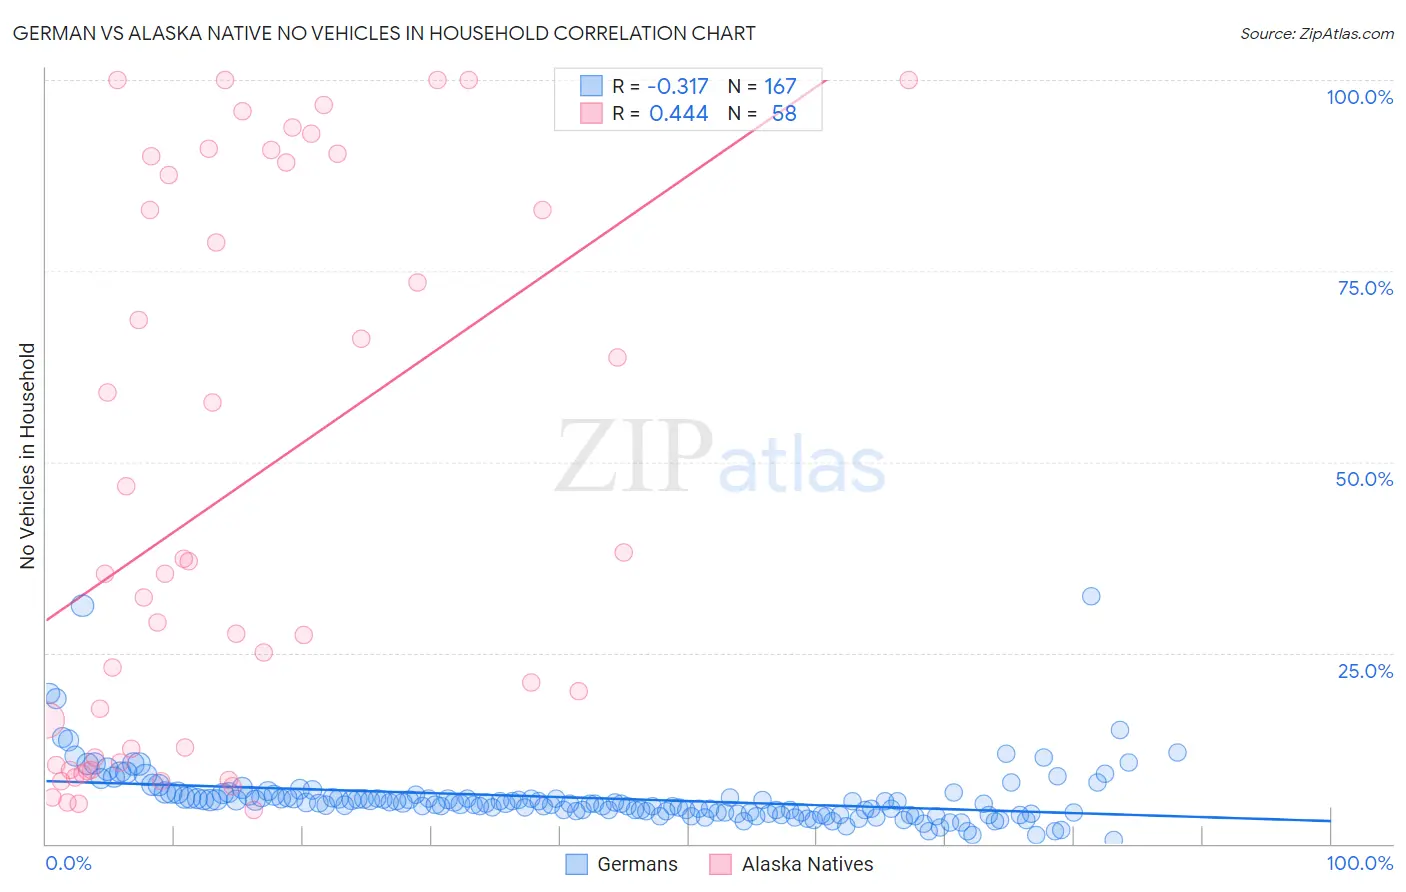
German vs Alaska Native No Vehicles in Household Correlation Chart
The statistical analysis conducted on geographies consisting of 573,819,115 people shows a mild negative correlation between the proportion of Germans and percentage of households with no vehicle available in the United States with a correlation coefficient (R) of -0.317 and weighted average of 6.7%. Similarly, the statistical analysis conducted on geographies consisting of 76,683,354 people shows a moderate positive correlation between the proportion of Alaska Natives and percentage of households with no vehicle available in the United States with a correlation coefficient (R) of 0.444 and weighted average of 17.4%, a difference of 160.7%.
No Vehicles in Household Correlation Summary
| Measurement | German | Alaska Native |
| Minimum | 0.56% | 4.5% |
| Maximum | 32.3% | 100.0% |
| Range | 31.8% | 95.5% |
| Mean | 6.0% | 46.2% |
| Median | 5.3% | 35.3% |
| Interquartile 25% (IQ1) | 4.1% | 10.7% |
| Interquartile 75% (IQ3) | 6.1% | 87.5% |
| Interquartile Range (IQR) | 2.0% | 76.8% |
| Standard Deviation (Sample) | 4.0% | 35.6% |
| Standard Deviation (Population) | 4.0% | 35.3% |
Similar Demographics by No Vehicles in Household
Demographics Similar to Germans by No Vehicles in Household
In terms of no vehicles in household, the demographic groups most similar to Germans are Yakama (6.6%, a difference of 0.99%), Scottish (6.8%, a difference of 1.3%), Danish (6.6%, a difference of 1.3%), Swedish (6.8%, a difference of 1.8%), and Scotch-Irish (6.8%, a difference of 2.0%).
| Demographics | Rating | Rank | No Vehicles in Household |
| Luxembourgers | 100.0 /100 | #1 | Exceptional 5.4% |
| Norwegians | 100.0 /100 | #2 | Exceptional 6.4% |
| English | 100.0 /100 | #3 | Exceptional 6.5% |
| Danes | 100.0 /100 | #4 | Exceptional 6.6% |
| Yakama | 100.0 /100 | #5 | Exceptional 6.6% |
| Germans | 100.0 /100 | #6 | Exceptional 6.7% |
| Scottish | 100.0 /100 | #7 | Exceptional 6.8% |
| Swedes | 100.0 /100 | #8 | Exceptional 6.8% |
| Scotch-Irish | 100.0 /100 | #9 | Exceptional 6.8% |
| Dutch | 100.0 /100 | #10 | Exceptional 6.8% |
| Czechs | 100.0 /100 | #11 | Exceptional 6.9% |
| Assyrians/Chaldeans/Syriacs | 100.0 /100 | #12 | Exceptional 7.0% |
| Scandinavians | 100.0 /100 | #13 | Exceptional 7.0% |
| Mexicans | 100.0 /100 | #14 | Exceptional 7.0% |
| Whites/Caucasians | 100.0 /100 | #15 | Exceptional 7.0% |
Demographics Similar to Alaska Natives by No Vehicles in Household
In terms of no vehicles in household, the demographic groups most similar to Alaska Natives are Soviet Union (17.4%, a difference of 0.16%), Jamaican (17.9%, a difference of 3.0%), Immigrants from Belarus (16.7%, a difference of 3.9%), Immigrants from Ghana (16.6%, a difference of 4.8%), and Ghanaian (16.4%, a difference of 5.8%).
| Demographics | Rating | Rank | No Vehicles in Household |
| Alaskan Athabascans | 0.0 /100 | #312 | Tragic 15.6% |
| Tohono O'odham | 0.0 /100 | #313 | Tragic 15.6% |
| Albanians | 0.0 /100 | #314 | Tragic 15.6% |
| Cypriots | 0.0 /100 | #315 | Tragic 15.7% |
| Ghanaians | 0.0 /100 | #316 | Tragic 16.4% |
| Immigrants | Ghana | 0.0 /100 | #317 | Tragic 16.6% |
| Immigrants | Belarus | 0.0 /100 | #318 | Tragic 16.7% |
| Alaska Natives | 0.0 /100 | #319 | Tragic 17.4% |
| Soviet Union | 0.0 /100 | #320 | Tragic 17.4% |
| Jamaicans | 0.0 /100 | #321 | Tragic 17.9% |
| Immigrants | Cabo Verde | 0.0 /100 | #322 | Tragic 18.4% |
| Immigrants | Yemen | 0.0 /100 | #323 | Tragic 19.5% |
| Immigrants | Caribbean | 0.0 /100 | #324 | Tragic 19.6% |
| Senegalese | 0.0 /100 | #325 | Tragic 19.8% |
| Immigrants | West Indies | 0.0 /100 | #326 | Tragic 20.5% |