Central American vs Immigrants from Ecuador In Labor Force | Age 20-64
COMPARE
Central American
Immigrants from Ecuador
In Labor Force | Age 20-64
In Labor Force | Age 20-64 Comparison
Central Americans
Immigrants from Ecuador
79.1%
IN LABOR FORCE | AGE 20-64
5.9/ 100
METRIC RATING
226th/ 347
METRIC RANK
79.3%
IN LABOR FORCE | AGE 20-64
16.9/ 100
METRIC RATING
206th/ 347
METRIC RANK
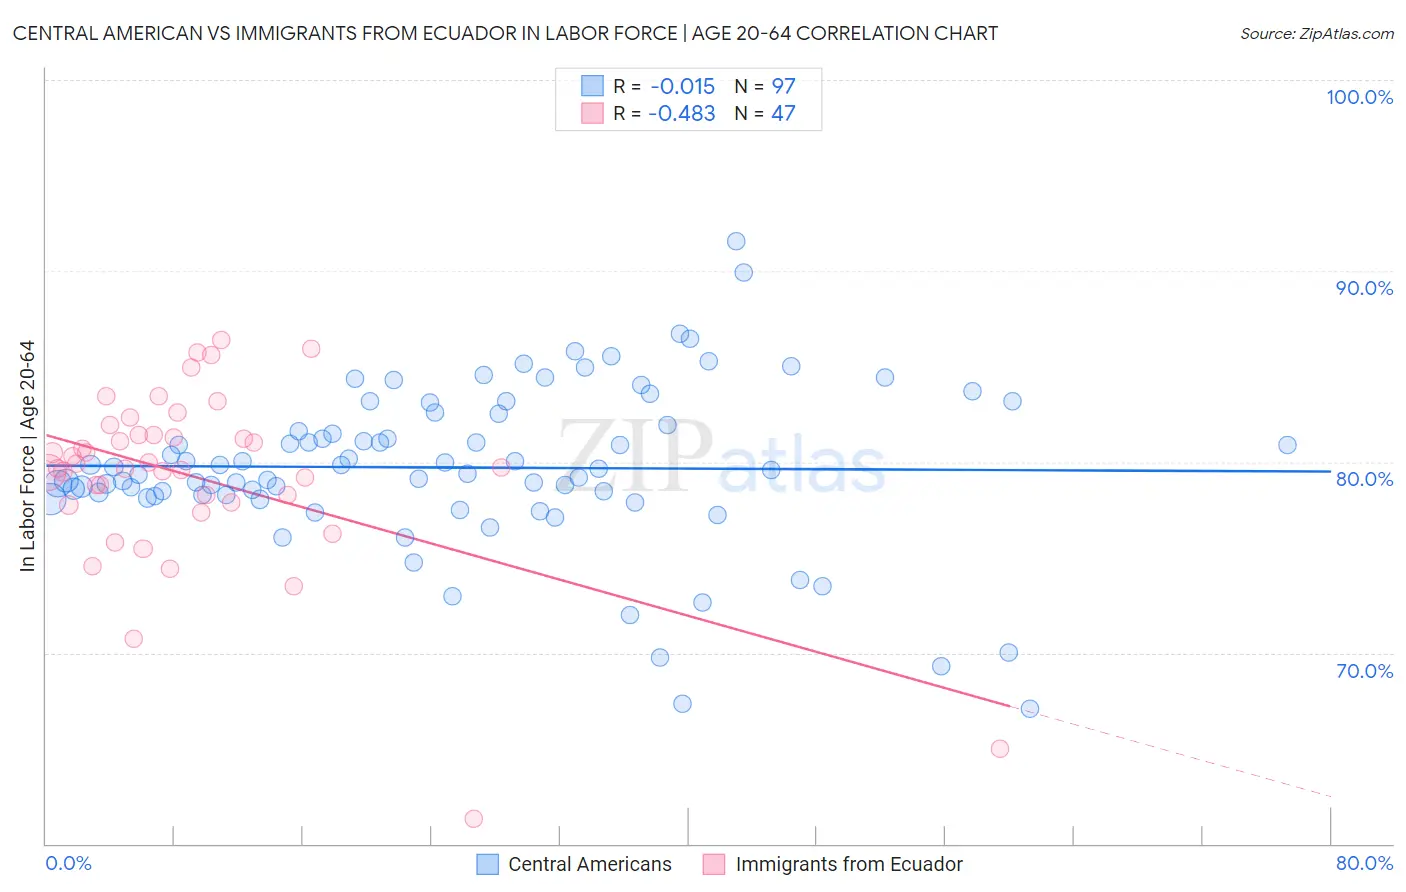
Central American vs Immigrants from Ecuador In Labor Force | Age 20-64 Correlation Chart
The statistical analysis conducted on geographies consisting of 504,611,399 people shows no correlation between the proportion of Central Americans and labor force participation rate among population between the ages 20 and 64 in the United States with a correlation coefficient (R) of -0.015 and weighted average of 79.1%. Similarly, the statistical analysis conducted on geographies consisting of 271,016,720 people shows a moderate negative correlation between the proportion of Immigrants from Ecuador and labor force participation rate among population between the ages 20 and 64 in the United States with a correlation coefficient (R) of -0.483 and weighted average of 79.3%, a difference of 0.24%.
In Labor Force | Age 20-64 Correlation Summary
| Measurement | Central American | Immigrants from Ecuador |
| Minimum | 67.1% | 61.3% |
| Maximum | 91.6% | 86.4% |
| Range | 24.5% | 25.1% |
| Mean | 79.7% | 79.3% |
| Median | 79.6% | 79.7% |
| Interquartile 25% (IQ1) | 78.2% | 77.9% |
| Interquartile 75% (IQ3) | 82.2% | 81.4% |
| Interquartile Range (IQR) | 4.0% | 3.5% |
| Standard Deviation (Sample) | 4.3% | 4.8% |
| Standard Deviation (Population) | 4.2% | 4.7% |
Demographics Similar to Central Americans and Immigrants from Ecuador by In Labor Force | Age 20-64
In terms of in labor force | age 20-64, the demographic groups most similar to Central Americans are Portuguese (79.1%, a difference of 0.020%), Immigrants from Panama (79.1%, a difference of 0.030%), Canadian (79.1%, a difference of 0.030%), Immigrants from Uzbekistan (79.1%, a difference of 0.030%), and Hungarian (79.2%, a difference of 0.040%). Similarly, the demographic groups most similar to Immigrants from Ecuador are Subsaharan African (79.3%, a difference of 0.0%), British (79.3%, a difference of 0.010%), Bangladeshi (79.3%, a difference of 0.010%), Haitian (79.3%, a difference of 0.010%), and European (79.3%, a difference of 0.020%).
| Demographics | Rating | Rank | In Labor Force | Age 20-64 |
| Immigrants | Ecuador | 16.9 /100 | #206 | Poor 79.3% |
| Sub-Saharan Africans | 16.5 /100 | #207 | Poor 79.3% |
| British | 16.5 /100 | #208 | Poor 79.3% |
| Bangladeshis | 16.4 /100 | #209 | Poor 79.3% |
| Haitians | 16.1 /100 | #210 | Poor 79.3% |
| Europeans | 15.3 /100 | #211 | Poor 79.3% |
| Irish | 13.2 /100 | #212 | Poor 79.3% |
| Immigrants | Portugal | 12.8 /100 | #213 | Poor 79.3% |
| Immigrants | Armenia | 12.2 /100 | #214 | Poor 79.2% |
| Immigrants | Norway | 12.0 /100 | #215 | Poor 79.2% |
| Arabs | 11.4 /100 | #216 | Poor 79.2% |
| Immigrants | Western Asia | 11.0 /100 | #217 | Poor 79.2% |
| Immigrants | England | 9.3 /100 | #218 | Tragic 79.2% |
| French Canadians | 8.4 /100 | #219 | Tragic 79.2% |
| Immigrants | Immigrants | 7.7 /100 | #220 | Tragic 79.2% |
| Hungarians | 7.2 /100 | #221 | Tragic 79.2% |
| Immigrants | Panama | 6.9 /100 | #222 | Tragic 79.1% |
| Canadians | 6.8 /100 | #223 | Tragic 79.1% |
| Immigrants | Uzbekistan | 6.8 /100 | #224 | Tragic 79.1% |
| Portuguese | 6.4 /100 | #225 | Tragic 79.1% |
| Central Americans | 5.9 /100 | #226 | Tragic 79.1% |