Carpatho Rusyn vs Immigrants from Honduras Unemployment Among Ages 16 to 19 years
COMPARE
Carpatho Rusyn
Immigrants from Honduras
Unemployment Among Ages 16 to 19 years
Unemployment Among Ages 16 to 19 years Comparison
Carpatho Rusyns
Immigrants from Honduras
17.9%
UNEMPLOYMENT AMONG AGES 16 TO 19 YEARS
15.6/ 100
METRIC RATING
210th/ 347
METRIC RANK
19.0%
UNEMPLOYMENT AMONG AGES 16 TO 19 YEARS
0.1/ 100
METRIC RATING
266th/ 347
METRIC RANK
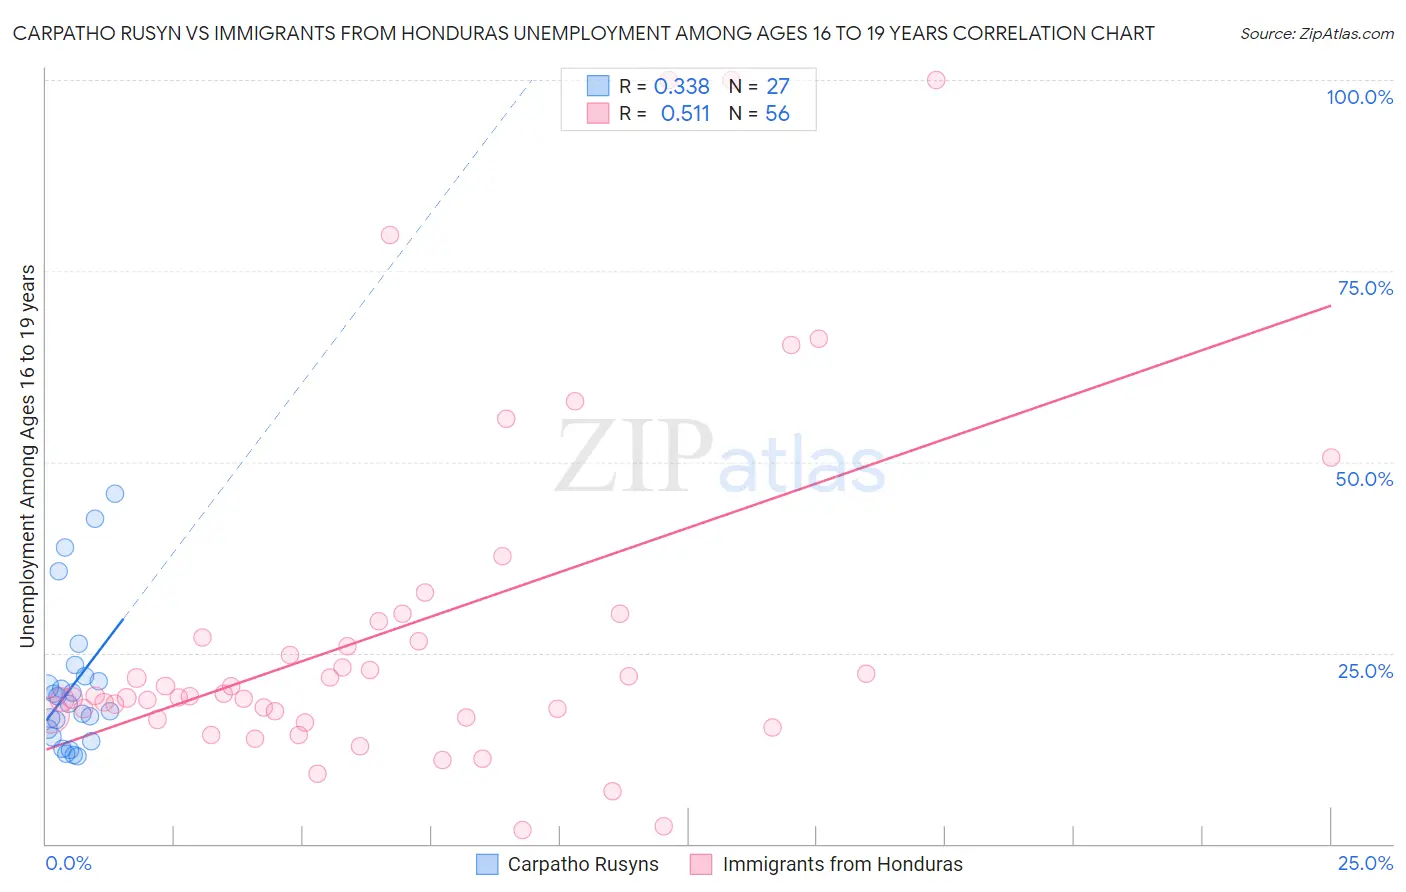
Carpatho Rusyn vs Immigrants from Honduras Unemployment Among Ages 16 to 19 years Correlation Chart
The statistical analysis conducted on geographies consisting of 57,767,385 people shows a mild positive correlation between the proportion of Carpatho Rusyns and unemployment rate among population between the ages 16 and 19 in the United States with a correlation coefficient (R) of 0.338 and weighted average of 17.9%. Similarly, the statistical analysis conducted on geographies consisting of 310,823,514 people shows a substantial positive correlation between the proportion of Immigrants from Honduras and unemployment rate among population between the ages 16 and 19 in the United States with a correlation coefficient (R) of 0.511 and weighted average of 19.0%, a difference of 5.9%.
Unemployment Among Ages 16 to 19 years Correlation Summary
| Measurement | Carpatho Rusyn | Immigrants from Honduras |
| Minimum | 11.5% | 1.8% |
| Maximum | 45.9% | 100.0% |
| Range | 34.4% | 98.2% |
| Mean | 20.7% | 28.1% |
| Median | 18.3% | 19.4% |
| Interquartile 25% (IQ1) | 14.0% | 16.7% |
| Interquartile 75% (IQ3) | 21.9% | 28.0% |
| Interquartile Range (IQR) | 7.9% | 11.4% |
| Standard Deviation (Sample) | 9.4% | 23.1% |
| Standard Deviation (Population) | 9.2% | 22.9% |
Similar Demographics by Unemployment Among Ages 16 to 19 years
Demographics Similar to Carpatho Rusyns by Unemployment Among Ages 16 to 19 years
In terms of unemployment among ages 16 to 19 years, the demographic groups most similar to Carpatho Rusyns are Cherokee (17.9%, a difference of 0.010%), Hawaiian (17.9%, a difference of 0.10%), Guamanian/Chamorro (17.9%, a difference of 0.10%), Argentinean (18.0%, a difference of 0.16%), and Chippewa (18.0%, a difference of 0.17%).
| Demographics | Rating | Rank | Unemployment Among Ages 16 to 19 years |
| Immigrants | Eastern Europe | 23.6 /100 | #203 | Fair 17.8% |
| Immigrants | Nonimmigrants | 20.9 /100 | #204 | Fair 17.9% |
| Assyrians/Chaldeans/Syriacs | 20.8 /100 | #205 | Fair 17.9% |
| Immigrants | Southern Europe | 18.9 /100 | #206 | Poor 17.9% |
| Liberians | 18.6 /100 | #207 | Poor 17.9% |
| Hawaiians | 16.8 /100 | #208 | Poor 17.9% |
| Cherokee | 15.7 /100 | #209 | Poor 17.9% |
| Carpatho Rusyns | 15.6 /100 | #210 | Poor 17.9% |
| Guamanians/Chamorros | 14.5 /100 | #211 | Poor 17.9% |
| Argentineans | 13.8 /100 | #212 | Poor 18.0% |
| Chippewa | 13.7 /100 | #213 | Poor 18.0% |
| Immigrants | Morocco | 13.5 /100 | #214 | Poor 18.0% |
| Immigrants | Syria | 13.3 /100 | #215 | Poor 18.0% |
| Immigrants | Kazakhstan | 13.0 /100 | #216 | Poor 18.0% |
| South American Indians | 13.0 /100 | #217 | Poor 18.0% |
Demographics Similar to Immigrants from Honduras by Unemployment Among Ages 16 to 19 years
In terms of unemployment among ages 16 to 19 years, the demographic groups most similar to Immigrants from Honduras are Choctaw (19.0%, a difference of 0.090%), Yaqui (19.0%, a difference of 0.10%), Cree (19.0%, a difference of 0.13%), Salvadoran (18.9%, a difference of 0.26%), and Spanish American Indian (18.9%, a difference of 0.30%).
| Demographics | Rating | Rank | Unemployment Among Ages 16 to 19 years |
| Immigrants | Central America | 0.2 /100 | #259 | Tragic 18.9% |
| Nigerians | 0.2 /100 | #260 | Tragic 18.9% |
| Spanish American Indians | 0.1 /100 | #261 | Tragic 18.9% |
| Salvadorans | 0.1 /100 | #262 | Tragic 18.9% |
| Cree | 0.1 /100 | #263 | Tragic 19.0% |
| Yaqui | 0.1 /100 | #264 | Tragic 19.0% |
| Choctaw | 0.1 /100 | #265 | Tragic 19.0% |
| Immigrants | Honduras | 0.1 /100 | #266 | Tragic 19.0% |
| Israelis | 0.1 /100 | #267 | Tragic 19.0% |
| Immigrants | El Salvador | 0.1 /100 | #268 | Tragic 19.1% |
| Lumbee | 0.1 /100 | #269 | Tragic 19.1% |
| Hondurans | 0.1 /100 | #270 | Tragic 19.2% |
| Blackfeet | 0.0 /100 | #271 | Tragic 19.2% |
| Hispanics or Latinos | 0.0 /100 | #272 | Tragic 19.2% |
| Immigrants | Panama | 0.0 /100 | #273 | Tragic 19.3% |