Cambodian vs Immigrants from Guyana Receiving Food Stamps
COMPARE
Cambodian
Immigrants from Guyana
Receiving Food Stamps
Receiving Food Stamps Comparison
Cambodians
Immigrants from Guyana
9.5%
RECEIVING FOOD STAMPS
99.5/ 100
METRIC RATING
41st/ 347
METRIC RANK
16.9%
RECEIVING FOOD STAMPS
0.0/ 100
METRIC RATING
314th/ 347
METRIC RANK
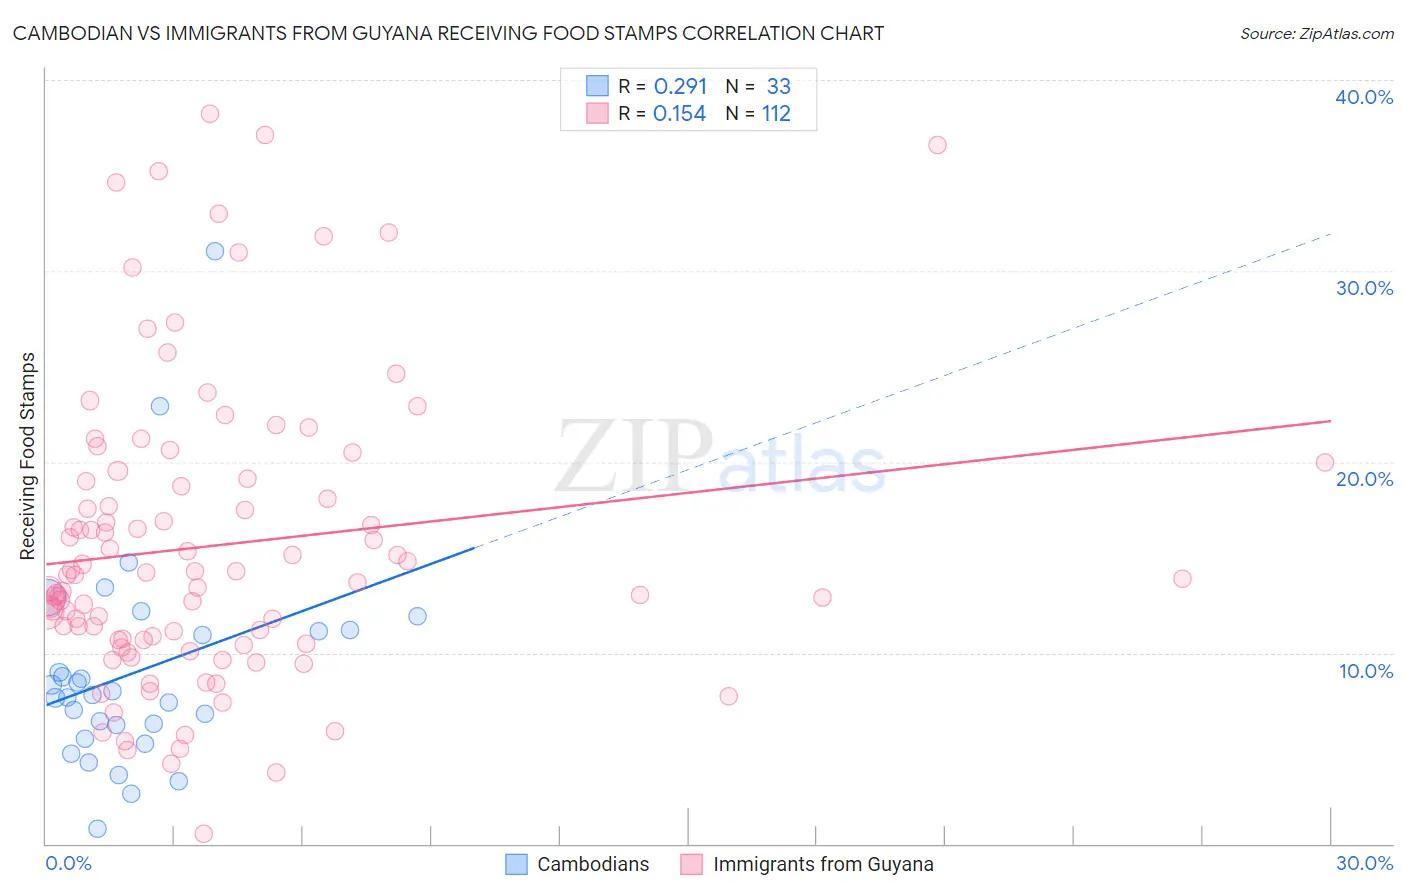
Cambodian vs Immigrants from Guyana Receiving Food Stamps Correlation Chart
The statistical analysis conducted on geographies consisting of 102,416,117 people shows a weak positive correlation between the proportion of Cambodians and percentage of population receiving government assistance and/or food stamps in the United States with a correlation coefficient (R) of 0.291 and weighted average of 9.5%. Similarly, the statistical analysis conducted on geographies consisting of 183,583,231 people shows a poor positive correlation between the proportion of Immigrants from Guyana and percentage of population receiving government assistance and/or food stamps in the United States with a correlation coefficient (R) of 0.154 and weighted average of 16.9%, a difference of 77.2%.
Receiving Food Stamps Correlation Summary
| Measurement | Cambodian | Immigrants from Guyana |
| Minimum | 0.80% | 0.50% |
| Maximum | 31.0% | 38.2% |
| Range | 30.2% | 37.7% |
| Mean | 9.0% | 15.6% |
| Median | 7.8% | 14.0% |
| Interquartile 25% (IQ1) | 5.8% | 10.7% |
| Interquartile 75% (IQ3) | 11.2% | 19.1% |
| Interquartile Range (IQR) | 5.3% | 8.4% |
| Standard Deviation (Sample) | 5.7% | 7.8% |
| Standard Deviation (Population) | 5.7% | 7.7% |
Similar Demographics by Receiving Food Stamps
Demographics Similar to Cambodians by Receiving Food Stamps
In terms of receiving food stamps, the demographic groups most similar to Cambodians are Immigrants from Netherlands (9.5%, a difference of 0.17%), Immigrants from Bolivia (9.5%, a difference of 0.18%), Immigrants from Sri Lanka (9.5%, a difference of 0.19%), Immigrants from China (9.6%, a difference of 0.25%), and European (9.5%, a difference of 0.48%).
| Demographics | Rating | Rank | Receiving Food Stamps |
| Turks | 99.6 /100 | #34 | Exceptional 9.5% |
| Immigrants | Austria | 99.6 /100 | #35 | Exceptional 9.5% |
| Estonians | 99.6 /100 | #36 | Exceptional 9.5% |
| Europeans | 99.6 /100 | #37 | Exceptional 9.5% |
| Immigrants | Sri Lanka | 99.5 /100 | #38 | Exceptional 9.5% |
| Immigrants | Bolivia | 99.5 /100 | #39 | Exceptional 9.5% |
| Immigrants | Netherlands | 99.5 /100 | #40 | Exceptional 9.5% |
| Cambodians | 99.5 /100 | #41 | Exceptional 9.5% |
| Immigrants | China | 99.5 /100 | #42 | Exceptional 9.6% |
| Croatians | 99.5 /100 | #43 | Exceptional 9.6% |
| Immigrants | Denmark | 99.4 /100 | #44 | Exceptional 9.6% |
| Immigrants | Belgium | 99.4 /100 | #45 | Exceptional 9.6% |
| Australians | 99.4 /100 | #46 | Exceptional 9.6% |
| Indians (Asian) | 99.4 /100 | #47 | Exceptional 9.6% |
| Russians | 99.4 /100 | #48 | Exceptional 9.6% |
Demographics Similar to Immigrants from Guyana by Receiving Food Stamps
In terms of receiving food stamps, the demographic groups most similar to Immigrants from Guyana are Immigrants from Jamaica (16.9%, a difference of 0.17%), Sioux (16.8%, a difference of 0.45%), Bahamian (17.0%, a difference of 0.57%), Central American Indian (17.1%, a difference of 1.0%), and Guyanese (16.7%, a difference of 1.2%).
| Demographics | Rating | Rank | Receiving Food Stamps |
| Houma | 0.0 /100 | #307 | Tragic 16.5% |
| Barbadians | 0.0 /100 | #308 | Tragic 16.5% |
| U.S. Virgin Islanders | 0.0 /100 | #309 | Tragic 16.5% |
| Immigrants | Barbados | 0.0 /100 | #310 | Tragic 16.6% |
| Guyanese | 0.0 /100 | #311 | Tragic 16.7% |
| Sioux | 0.0 /100 | #312 | Tragic 16.8% |
| Immigrants | Jamaica | 0.0 /100 | #313 | Tragic 16.9% |
| Immigrants | Guyana | 0.0 /100 | #314 | Tragic 16.9% |
| Bahamians | 0.0 /100 | #315 | Tragic 17.0% |
| Central American Indians | 0.0 /100 | #316 | Tragic 17.1% |
| Blacks/African Americans | 0.0 /100 | #317 | Tragic 17.2% |
| Menominee | 0.0 /100 | #318 | Tragic 17.2% |
| Immigrants | St. Vincent and the Grenadines | 0.0 /100 | #319 | Tragic 17.2% |
| Immigrants | Nicaragua | 0.0 /100 | #320 | Tragic 17.2% |
| Natives/Alaskans | 0.0 /100 | #321 | Tragic 17.3% |