Immigrants from Bangladesh vs Immigrants from Micronesia No Vehicles in Household
COMPARE
Immigrants from Bangladesh
Immigrants from Micronesia
No Vehicles in Household
No Vehicles in Household Comparison
Immigrants from Bangladesh
Immigrants from Micronesia
25.8%
NO VEHICLES IN HOUSEHOLD
0.0/ 100
METRIC RATING
334th/ 347
METRIC RANK
10.1%
NO VEHICLES IN HOUSEHOLD
70.9/ 100
METRIC RATING
156th/ 347
METRIC RANK
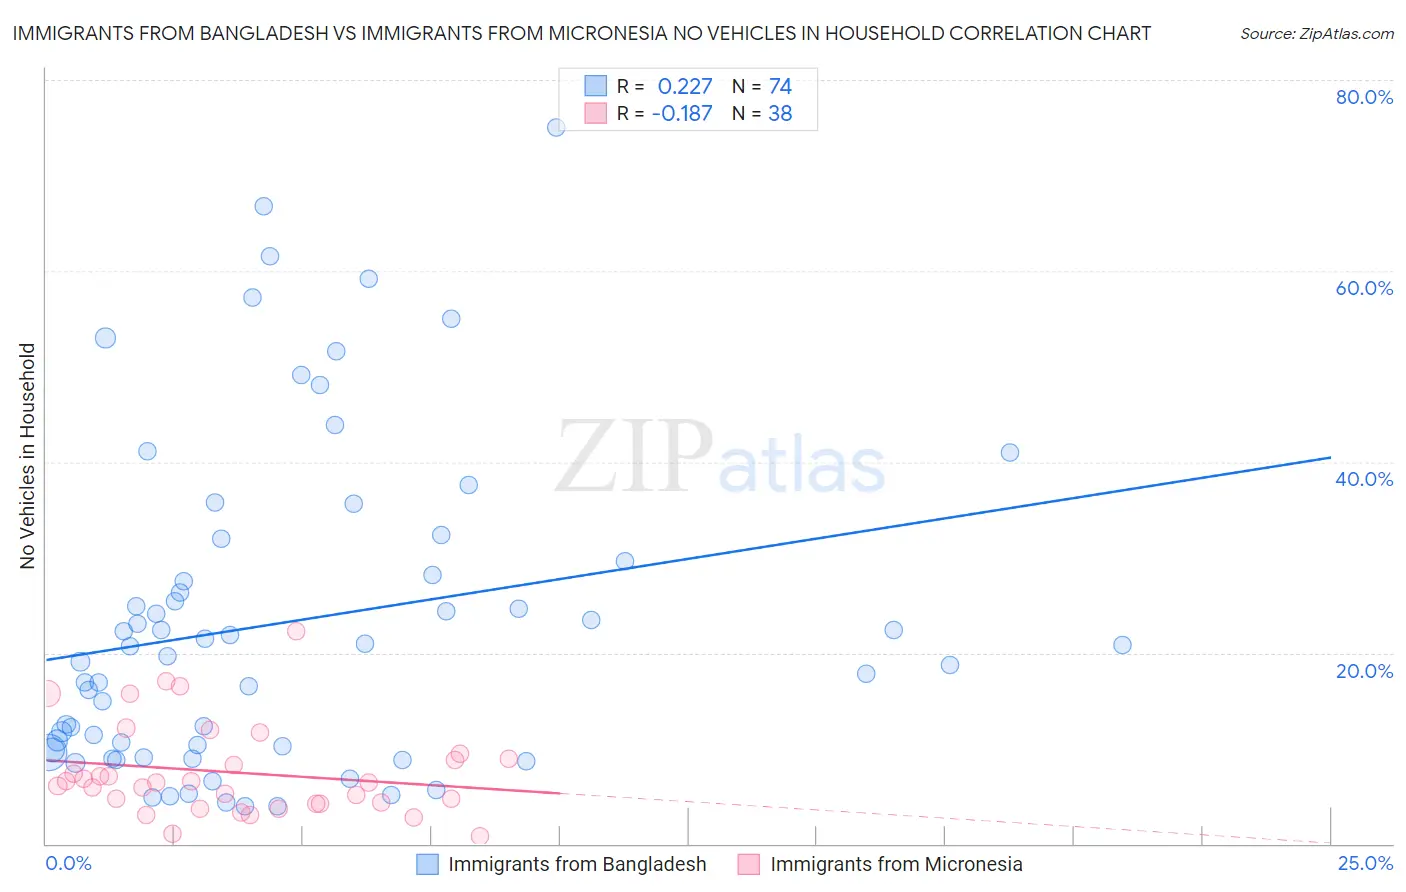
Immigrants from Bangladesh vs Immigrants from Micronesia No Vehicles in Household Correlation Chart
The statistical analysis conducted on geographies consisting of 203,492,873 people shows a weak positive correlation between the proportion of Immigrants from Bangladesh and percentage of households with no vehicle available in the United States with a correlation coefficient (R) of 0.227 and weighted average of 25.8%. Similarly, the statistical analysis conducted on geographies consisting of 61,571,663 people shows a poor negative correlation between the proportion of Immigrants from Micronesia and percentage of households with no vehicle available in the United States with a correlation coefficient (R) of -0.187 and weighted average of 10.1%, a difference of 155.2%.
No Vehicles in Household Correlation Summary
| Measurement | Immigrants from Bangladesh | Immigrants from Micronesia |
| Minimum | 3.9% | 0.77% |
| Maximum | 75.0% | 22.3% |
| Range | 71.1% | 21.5% |
| Mean | 23.3% | 7.5% |
| Median | 20.2% | 6.4% |
| Interquartile 25% (IQ1) | 9.9% | 4.2% |
| Interquartile 75% (IQ3) | 29.6% | 8.8% |
| Interquartile Range (IQR) | 19.7% | 4.7% |
| Standard Deviation (Sample) | 17.0% | 4.8% |
| Standard Deviation (Population) | 16.9% | 4.7% |
Similar Demographics by No Vehicles in Household
Demographics Similar to Immigrants from Bangladesh by No Vehicles in Household
In terms of no vehicles in household, the demographic groups most similar to Immigrants from Bangladesh are Barbadian (26.1%, a difference of 1.3%), Vietnamese (26.2%, a difference of 1.9%), Immigrants from Uzbekistan (26.7%, a difference of 3.5%), Immigrants from Trinidad and Tobago (24.6%, a difference of 4.5%), and Immigrants from Ecuador (23.8%, a difference of 8.1%).
| Demographics | Rating | Rank | No Vehicles in Household |
| Immigrants | Senegal | 0.0 /100 | #327 | Tragic 21.1% |
| Immigrants | Dominica | 0.0 /100 | #328 | Tragic 22.2% |
| Ecuadorians | 0.0 /100 | #329 | Tragic 22.8% |
| West Indians | 0.0 /100 | #330 | Tragic 23.7% |
| Trinidadians and Tobagonians | 0.0 /100 | #331 | Tragic 23.7% |
| Immigrants | Ecuador | 0.0 /100 | #332 | Tragic 23.8% |
| Immigrants | Trinidad and Tobago | 0.0 /100 | #333 | Tragic 24.6% |
| Immigrants | Bangladesh | 0.0 /100 | #334 | Tragic 25.8% |
| Barbadians | 0.0 /100 | #335 | Tragic 26.1% |
| Vietnamese | 0.0 /100 | #336 | Tragic 26.2% |
| Immigrants | Uzbekistan | 0.0 /100 | #337 | Tragic 26.7% |
| Guyanese | 0.0 /100 | #338 | Tragic 29.3% |
| Dominicans | 0.0 /100 | #339 | Tragic 29.4% |
| Immigrants | Barbados | 0.0 /100 | #340 | Tragic 29.5% |
| Immigrants | Guyana | 0.0 /100 | #341 | Tragic 29.5% |
Demographics Similar to Immigrants from Micronesia by No Vehicles in Household
In terms of no vehicles in household, the demographic groups most similar to Immigrants from Micronesia are Australian (10.1%, a difference of 0.050%), Spanish American Indian (10.1%, a difference of 0.11%), Salvadoran (10.1%, a difference of 0.25%), Immigrants from Indonesia (10.1%, a difference of 0.26%), and Sioux (10.1%, a difference of 0.27%).
| Demographics | Rating | Rank | No Vehicles in Household |
| Immigrants | Uganda | 76.1 /100 | #149 | Good 10.0% |
| Colombians | 73.9 /100 | #150 | Good 10.0% |
| Immigrants | Eastern Africa | 73.8 /100 | #151 | Good 10.0% |
| Immigrants | Congo | 73.0 /100 | #152 | Good 10.1% |
| Tlingit-Haida | 72.5 /100 | #153 | Good 10.1% |
| Sioux | 72.4 /100 | #154 | Good 10.1% |
| Salvadorans | 72.4 /100 | #155 | Good 10.1% |
| Immigrants | Micronesia | 70.9 /100 | #156 | Good 10.1% |
| Australians | 70.6 /100 | #157 | Good 10.1% |
| Spanish American Indians | 70.2 /100 | #158 | Good 10.1% |
| Immigrants | Indonesia | 69.3 /100 | #159 | Good 10.1% |
| Immigrants | Middle Africa | 65.7 /100 | #160 | Good 10.2% |
| New Zealanders | 65.1 /100 | #161 | Good 10.2% |
| Immigrants | Austria | 64.4 /100 | #162 | Good 10.2% |
| Immigrants | Cambodia | 63.7 /100 | #163 | Good 10.2% |