Black/African American vs Immigrants from Northern Europe 1 or more Vehicles in Household
COMPARE
Black/African American
Immigrants from Northern Europe
1 or more Vehicles in Household
1 or more Vehicles in Household Comparison
Blacks/African Americans
Immigrants from Northern Europe
88.2%
1 OR MORE VEHICLES IN HOUSEHOLD
1.4/ 100
METRIC RATING
249th/ 347
METRIC RANK
89.5%
1 OR MORE VEHICLES IN HOUSEHOLD
35.5/ 100
METRIC RATING
193rd/ 347
METRIC RANK
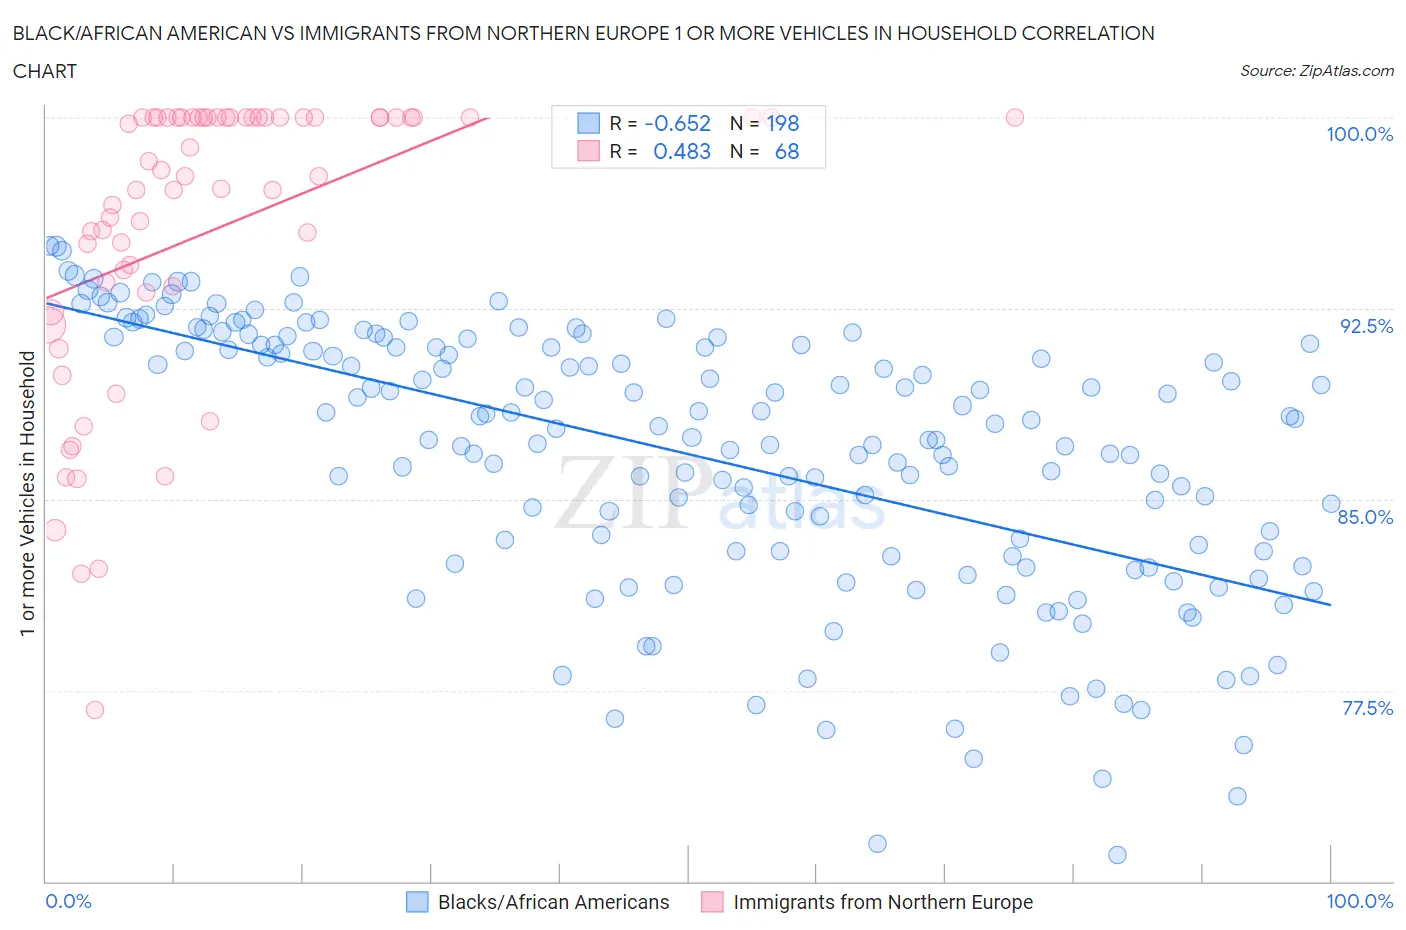
Black/African American vs Immigrants from Northern Europe 1 or more Vehicles in Household Correlation Chart
The statistical analysis conducted on geographies consisting of 553,575,215 people shows a significant negative correlation between the proportion of Blacks/African Americans and percentage of households with 1 or more vehicles available in the United States with a correlation coefficient (R) of -0.652 and weighted average of 88.2%. Similarly, the statistical analysis conducted on geographies consisting of 476,984,908 people shows a moderate positive correlation between the proportion of Immigrants from Northern Europe and percentage of households with 1 or more vehicles available in the United States with a correlation coefficient (R) of 0.483 and weighted average of 89.5%, a difference of 1.5%.
1 or more Vehicles in Household Correlation Summary
| Measurement | Black/African American | Immigrants from Northern Europe |
| Minimum | 71.0% | 76.7% |
| Maximum | 95.0% | 100.0% |
| Range | 23.9% | 23.3% |
| Mean | 86.8% | 95.6% |
| Median | 87.9% | 97.7% |
| Interquartile 25% (IQ1) | 82.9% | 93.2% |
| Interquartile 75% (IQ3) | 91.1% | 100.0% |
| Interquartile Range (IQR) | 8.1% | 6.8% |
| Standard Deviation (Sample) | 5.3% | 5.7% |
| Standard Deviation (Population) | 5.3% | 5.6% |
Similar Demographics by 1 or more Vehicles in Household
Demographics Similar to Blacks/African Americans by 1 or more Vehicles in Household
In terms of 1 or more vehicles in household, the demographic groups most similar to Blacks/African Americans are Egyptian (88.2%, a difference of 0.040%), Immigrants from Nigeria (88.2%, a difference of 0.050%), Immigrants from Serbia (88.2%, a difference of 0.050%), Immigrants from Honduras (88.3%, a difference of 0.090%), and Immigrants from Uruguay (88.1%, a difference of 0.11%).
| Demographics | Rating | Rank | 1 or more Vehicles in Household |
| Turks | 2.5 /100 | #242 | Tragic 88.4% |
| Immigrants | Belgium | 2.1 /100 | #243 | Tragic 88.4% |
| Immigrants | Portugal | 2.0 /100 | #244 | Tragic 88.3% |
| Immigrants | Czechoslovakia | 1.9 /100 | #245 | Tragic 88.3% |
| Menominee | 1.9 /100 | #246 | Tragic 88.3% |
| Immigrants | Honduras | 1.7 /100 | #247 | Tragic 88.3% |
| Immigrants | Nigeria | 1.5 /100 | #248 | Tragic 88.2% |
| Blacks/African Americans | 1.4 /100 | #249 | Tragic 88.2% |
| Egyptians | 1.2 /100 | #250 | Tragic 88.2% |
| Immigrants | Serbia | 1.2 /100 | #251 | Tragic 88.2% |
| Immigrants | Uruguay | 1.1 /100 | #252 | Tragic 88.1% |
| Hondurans | 1.0 /100 | #253 | Tragic 88.1% |
| Haitians | 0.9 /100 | #254 | Tragic 88.1% |
| Immigrants | Latvia | 0.9 /100 | #255 | Tragic 88.1% |
| Colombians | 0.9 /100 | #256 | Tragic 88.0% |
Demographics Similar to Immigrants from Northern Europe by 1 or more Vehicles in Household
In terms of 1 or more vehicles in household, the demographic groups most similar to Immigrants from Northern Europe are Immigrants from North Macedonia (89.5%, a difference of 0.020%), Shoshone (89.5%, a difference of 0.030%), Immigrants from Poland (89.5%, a difference of 0.030%), Carpatho Rusyn (89.5%, a difference of 0.040%), and Immigrants from Eritrea (89.4%, a difference of 0.040%).
| Demographics | Rating | Rank | 1 or more Vehicles in Household |
| Pueblo | 39.9 /100 | #186 | Fair 89.6% |
| South Americans | 39.6 /100 | #187 | Fair 89.5% |
| Immigrants | Nepal | 38.9 /100 | #188 | Fair 89.5% |
| Carpatho Rusyns | 37.8 /100 | #189 | Fair 89.5% |
| Shoshone | 37.5 /100 | #190 | Fair 89.5% |
| Immigrants | Poland | 37.1 /100 | #191 | Fair 89.5% |
| Immigrants | North Macedonia | 36.5 /100 | #192 | Fair 89.5% |
| Immigrants | Northern Europe | 35.5 /100 | #193 | Fair 89.5% |
| Immigrants | Eritrea | 33.2 /100 | #194 | Fair 89.4% |
| Immigrants | Armenia | 31.8 /100 | #195 | Fair 89.4% |
| Crow | 24.3 /100 | #196 | Fair 89.3% |
| Immigrants | Sweden | 23.6 /100 | #197 | Fair 89.3% |
| Pennsylvania Germans | 22.9 /100 | #198 | Fair 89.3% |
| Immigrants | Asia | 22.8 /100 | #199 | Fair 89.3% |
| Central Americans | 21.4 /100 | #200 | Fair 89.2% |