Black/African American vs Immigrants from Jordan 1 or more Vehicles in Household
COMPARE
Black/African American
Immigrants from Jordan
1 or more Vehicles in Household
1 or more Vehicles in Household Comparison
Blacks/African Americans
Immigrants from Jordan
88.2%
1 OR MORE VEHICLES IN HOUSEHOLD
1.4/ 100
METRIC RATING
249th/ 347
METRIC RANK
91.4%
1 OR MORE VEHICLES IN HOUSEHOLD
99.2/ 100
METRIC RATING
91st/ 347
METRIC RANK
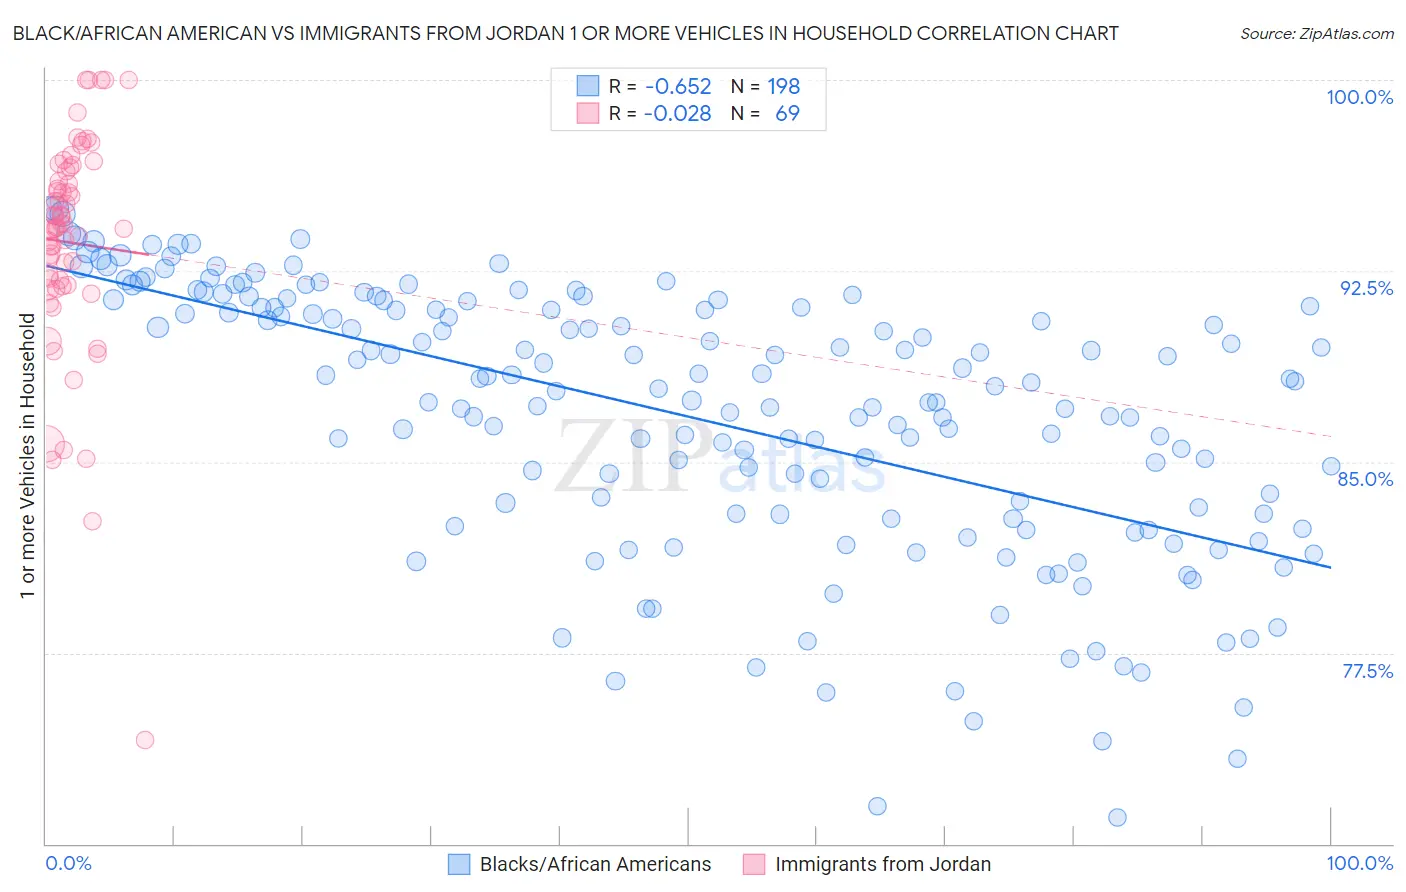
Black/African American vs Immigrants from Jordan 1 or more Vehicles in Household Correlation Chart
The statistical analysis conducted on geographies consisting of 553,575,215 people shows a significant negative correlation between the proportion of Blacks/African Americans and percentage of households with 1 or more vehicles available in the United States with a correlation coefficient (R) of -0.652 and weighted average of 88.2%. Similarly, the statistical analysis conducted on geographies consisting of 181,238,017 people shows no correlation between the proportion of Immigrants from Jordan and percentage of households with 1 or more vehicles available in the United States with a correlation coefficient (R) of -0.028 and weighted average of 91.4%, a difference of 3.6%.
1 or more Vehicles in Household Correlation Summary
| Measurement | Black/African American | Immigrants from Jordan |
| Minimum | 71.0% | 74.1% |
| Maximum | 95.0% | 100.0% |
| Range | 23.9% | 25.9% |
| Mean | 86.8% | 93.6% |
| Median | 87.9% | 94.2% |
| Interquartile 25% (IQ1) | 82.9% | 91.9% |
| Interquartile 75% (IQ3) | 91.1% | 96.5% |
| Interquartile Range (IQR) | 8.1% | 4.5% |
| Standard Deviation (Sample) | 5.3% | 4.4% |
| Standard Deviation (Population) | 5.3% | 4.4% |
Similar Demographics by 1 or more Vehicles in Household
Demographics Similar to Blacks/African Americans by 1 or more Vehicles in Household
In terms of 1 or more vehicles in household, the demographic groups most similar to Blacks/African Americans are Egyptian (88.2%, a difference of 0.040%), Immigrants from Nigeria (88.2%, a difference of 0.050%), Immigrants from Serbia (88.2%, a difference of 0.050%), Immigrants from Honduras (88.3%, a difference of 0.090%), and Immigrants from Uruguay (88.1%, a difference of 0.11%).
| Demographics | Rating | Rank | 1 or more Vehicles in Household |
| Turks | 2.5 /100 | #242 | Tragic 88.4% |
| Immigrants | Belgium | 2.1 /100 | #243 | Tragic 88.4% |
| Immigrants | Portugal | 2.0 /100 | #244 | Tragic 88.3% |
| Immigrants | Czechoslovakia | 1.9 /100 | #245 | Tragic 88.3% |
| Menominee | 1.9 /100 | #246 | Tragic 88.3% |
| Immigrants | Honduras | 1.7 /100 | #247 | Tragic 88.3% |
| Immigrants | Nigeria | 1.5 /100 | #248 | Tragic 88.2% |
| Blacks/African Americans | 1.4 /100 | #249 | Tragic 88.2% |
| Egyptians | 1.2 /100 | #250 | Tragic 88.2% |
| Immigrants | Serbia | 1.2 /100 | #251 | Tragic 88.2% |
| Immigrants | Uruguay | 1.1 /100 | #252 | Tragic 88.1% |
| Hondurans | 1.0 /100 | #253 | Tragic 88.1% |
| Haitians | 0.9 /100 | #254 | Tragic 88.1% |
| Immigrants | Latvia | 0.9 /100 | #255 | Tragic 88.1% |
| Colombians | 0.9 /100 | #256 | Tragic 88.0% |
Demographics Similar to Immigrants from Jordan by 1 or more Vehicles in Household
In terms of 1 or more vehicles in household, the demographic groups most similar to Immigrants from Jordan are Spanish American (91.4%, a difference of 0.0%), Bangladeshi (91.4%, a difference of 0.0%), Immigrants from Canada (91.4%, a difference of 0.0%), Immigrants from Germany (91.4%, a difference of 0.010%), and Bhutanese (91.4%, a difference of 0.010%).
| Demographics | Rating | Rank | 1 or more Vehicles in Household |
| Jordanians | 99.3 /100 | #84 | Exceptional 91.4% |
| Tsimshian | 99.3 /100 | #85 | Exceptional 91.4% |
| Osage | 99.2 /100 | #86 | Exceptional 91.4% |
| Immigrants | Germany | 99.2 /100 | #87 | Exceptional 91.4% |
| Spanish Americans | 99.2 /100 | #88 | Exceptional 91.4% |
| Bangladeshis | 99.2 /100 | #89 | Exceptional 91.4% |
| Immigrants | Canada | 99.2 /100 | #90 | Exceptional 91.4% |
| Immigrants | Jordan | 99.2 /100 | #91 | Exceptional 91.4% |
| Bhutanese | 99.2 /100 | #92 | Exceptional 91.4% |
| Immigrants | North America | 99.2 /100 | #93 | Exceptional 91.4% |
| Immigrants | Cuba | 99.1 /100 | #94 | Exceptional 91.3% |
| Austrians | 99.0 /100 | #95 | Exceptional 91.3% |
| Potawatomi | 99.0 /100 | #96 | Exceptional 91.3% |
| Pakistanis | 99.0 /100 | #97 | Exceptional 91.3% |
| Slavs | 98.7 /100 | #98 | Exceptional 91.2% |