White/Caucasian vs Immigrants from Afghanistan 1 or more Vehicles in Household
COMPARE
White/Caucasian
Immigrants from Afghanistan
1 or more Vehicles in Household
1 or more Vehicles in Household Comparison
Whites/Caucasians
Immigrants from Afghanistan
93.1%
1 OR MORE VEHICLES IN HOUSEHOLD
100.0/ 100
METRIC RATING
13th/ 347
METRIC RANK
92.0%
1 OR MORE VEHICLES IN HOUSEHOLD
99.9/ 100
METRIC RATING
55th/ 347
METRIC RANK
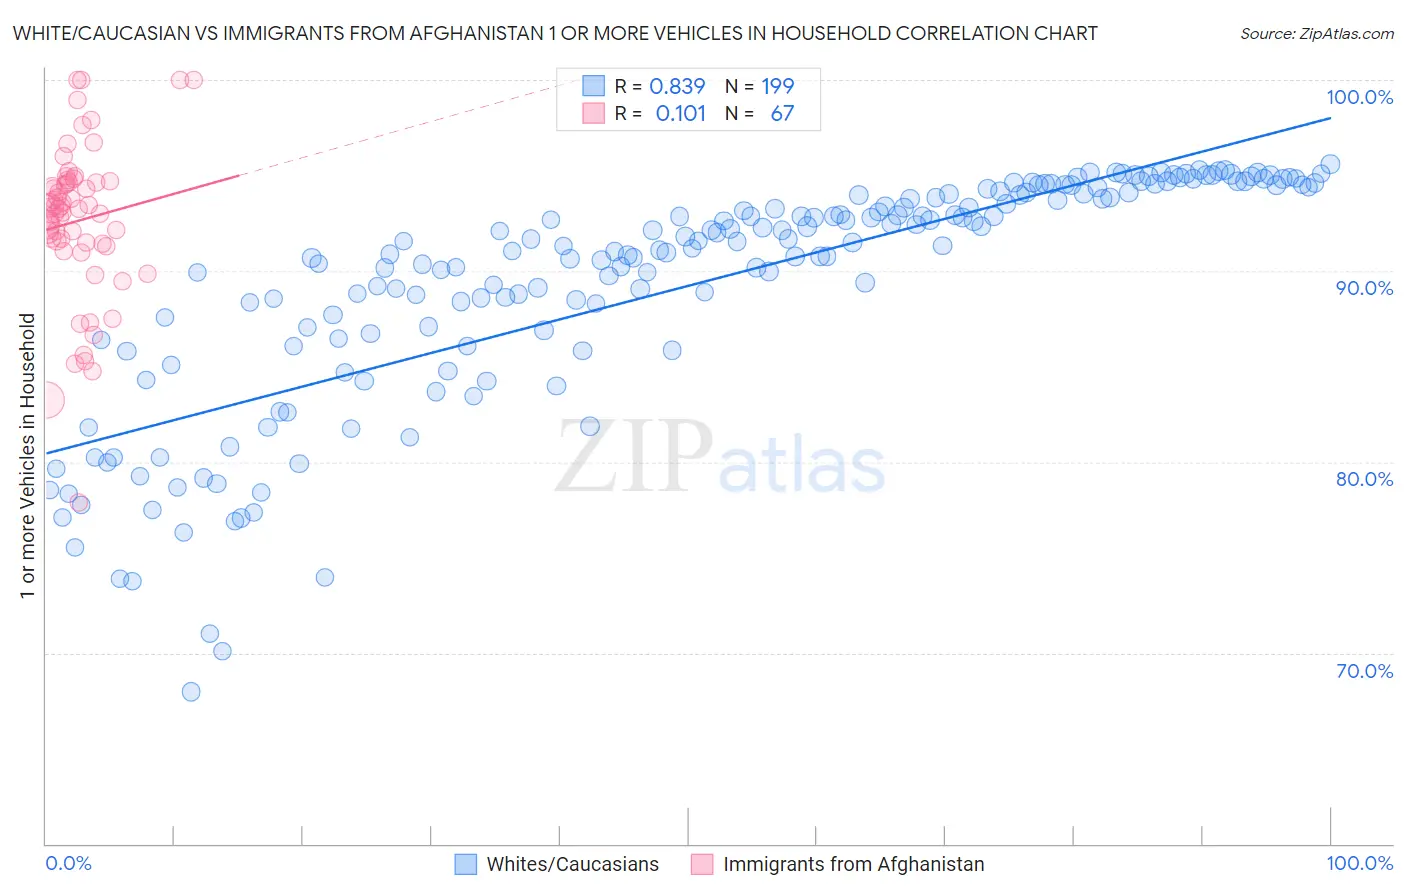
White/Caucasian vs Immigrants from Afghanistan 1 or more Vehicles in Household Correlation Chart
The statistical analysis conducted on geographies consisting of 571,958,607 people shows a very strong positive correlation between the proportion of Whites/Caucasians and percentage of households with 1 or more vehicles available in the United States with a correlation coefficient (R) of 0.839 and weighted average of 93.1%. Similarly, the statistical analysis conducted on geographies consisting of 147,625,417 people shows a poor positive correlation between the proportion of Immigrants from Afghanistan and percentage of households with 1 or more vehicles available in the United States with a correlation coefficient (R) of 0.101 and weighted average of 92.0%, a difference of 1.2%.
1 or more Vehicles in Household Correlation Summary
| Measurement | White/Caucasian | Immigrants from Afghanistan |
| Minimum | 68.0% | 77.9% |
| Maximum | 95.6% | 100.0% |
| Range | 27.6% | 22.1% |
| Mean | 89.2% | 92.6% |
| Median | 91.3% | 93.3% |
| Interquartile 25% (IQ1) | 86.4% | 91.4% |
| Interquartile 75% (IQ3) | 94.0% | 94.6% |
| Interquartile Range (IQR) | 7.6% | 3.2% |
| Standard Deviation (Sample) | 6.1% | 4.1% |
| Standard Deviation (Population) | 6.1% | 4.1% |
Similar Demographics by 1 or more Vehicles in Household
Demographics Similar to Whites/Caucasians by 1 or more Vehicles in Household
In terms of 1 or more vehicles in household, the demographic groups most similar to Whites/Caucasians are Scandinavian (93.1%, a difference of 0.020%), Irish (93.1%, a difference of 0.040%), Mexican (93.0%, a difference of 0.060%), Assyrian/Chaldean/Syriac (93.0%, a difference of 0.060%), and European (93.0%, a difference of 0.090%).
| Demographics | Rating | Rank | 1 or more Vehicles in Household |
| Danes | 100.0 /100 | #6 | Exceptional 93.5% |
| Scottish | 100.0 /100 | #7 | Exceptional 93.4% |
| Swedes | 100.0 /100 | #8 | Exceptional 93.3% |
| Scotch-Irish | 100.0 /100 | #9 | Exceptional 93.3% |
| Dutch | 100.0 /100 | #10 | Exceptional 93.3% |
| Czechs | 100.0 /100 | #11 | Exceptional 93.3% |
| Scandinavians | 100.0 /100 | #12 | Exceptional 93.1% |
| Whites/Caucasians | 100.0 /100 | #13 | Exceptional 93.1% |
| Irish | 100.0 /100 | #14 | Exceptional 93.1% |
| Mexicans | 100.0 /100 | #15 | Exceptional 93.0% |
| Assyrians/Chaldeans/Syriacs | 100.0 /100 | #16 | Exceptional 93.0% |
| Europeans | 100.0 /100 | #17 | Exceptional 93.0% |
| Welsh | 100.0 /100 | #18 | Exceptional 93.0% |
| Tongans | 100.0 /100 | #19 | Exceptional 92.9% |
| Arapaho | 100.0 /100 | #20 | Exceptional 92.7% |
Demographics Similar to Immigrants from Afghanistan by 1 or more Vehicles in Household
In terms of 1 or more vehicles in household, the demographic groups most similar to Immigrants from Afghanistan are Immigrants from Venezuela (92.0%, a difference of 0.0%), Iraqi (91.9%, a difference of 0.040%), Slovene (92.0%, a difference of 0.060%), Immigrants from Mexico (91.9%, a difference of 0.060%), and Hawaiian (92.0%, a difference of 0.070%).
| Demographics | Rating | Rank | 1 or more Vehicles in Household |
| Belgians | 99.9 /100 | #48 | Exceptional 92.1% |
| Afghans | 99.9 /100 | #49 | Exceptional 92.1% |
| Guamanians/Chamorros | 99.9 /100 | #50 | Exceptional 92.1% |
| Celtics | 99.9 /100 | #51 | Exceptional 92.1% |
| Koreans | 99.9 /100 | #52 | Exceptional 92.1% |
| Hawaiians | 99.9 /100 | #53 | Exceptional 92.0% |
| Slovenes | 99.9 /100 | #54 | Exceptional 92.0% |
| Immigrants | Afghanistan | 99.9 /100 | #55 | Exceptional 92.0% |
| Immigrants | Venezuela | 99.9 /100 | #56 | Exceptional 92.0% |
| Iraqis | 99.8 /100 | #57 | Exceptional 91.9% |
| Immigrants | Mexico | 99.8 /100 | #58 | Exceptional 91.9% |
| Venezuelans | 99.8 /100 | #59 | Exceptional 91.9% |
| Slovaks | 99.8 /100 | #60 | Exceptional 91.9% |
| Immigrants | India | 99.8 /100 | #61 | Exceptional 91.9% |
| Thais | 99.8 /100 | #62 | Exceptional 91.9% |