Asian vs Menominee Unemployment Among Ages 35 to 44 years
COMPARE
Asian
Menominee
Unemployment Among Ages 35 to 44 years
Unemployment Among Ages 35 to 44 years Comparison
Asians
Menominee
4.4%
UNEMPLOYMENT AMONG AGES 35 TO 44 YEARS
97.4/ 100
METRIC RATING
54th/ 347
METRIC RANK
6.5%
UNEMPLOYMENT AMONG AGES 35 TO 44 YEARS
0.0/ 100
METRIC RATING
324th/ 347
METRIC RANK
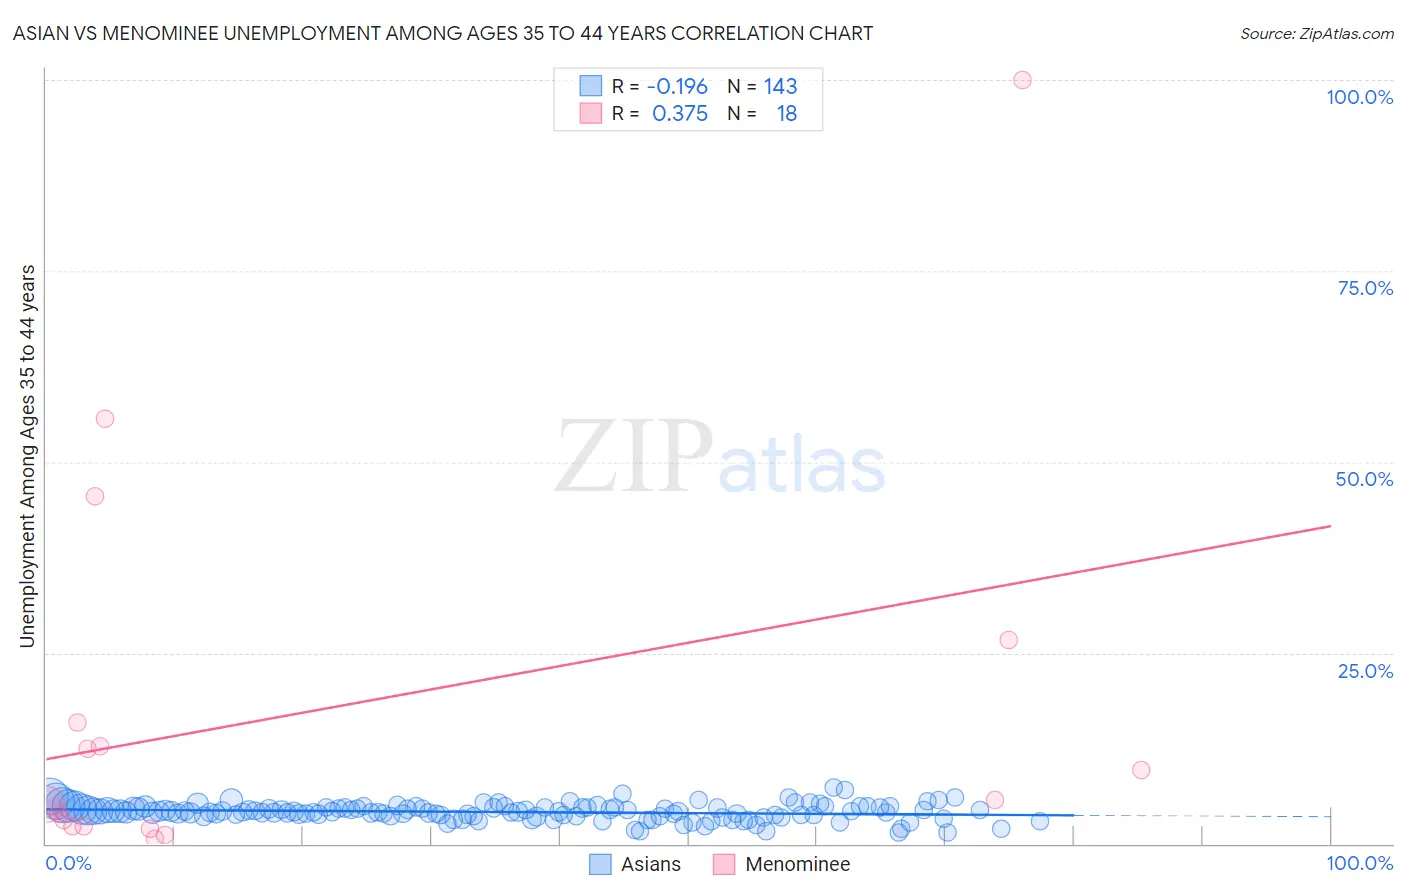
Asian vs Menominee Unemployment Among Ages 35 to 44 years Correlation Chart
The statistical analysis conducted on geographies consisting of 521,064,824 people shows a poor negative correlation between the proportion of Asians and unemployment rate among population between the ages 35 and 44 in the United States with a correlation coefficient (R) of -0.196 and weighted average of 4.4%. Similarly, the statistical analysis conducted on geographies consisting of 45,418,932 people shows a mild positive correlation between the proportion of Menominee and unemployment rate among population between the ages 35 and 44 in the United States with a correlation coefficient (R) of 0.375 and weighted average of 6.5%, a difference of 48.8%.
Unemployment Among Ages 35 to 44 years Correlation Summary
| Measurement | Asian | Menominee |
| Minimum | 1.4% | 0.60% |
| Maximum | 7.3% | 100.0% |
| Range | 5.9% | 99.4% |
| Mean | 4.2% | 17.2% |
| Median | 4.2% | 5.4% |
| Interquartile 25% (IQ1) | 3.6% | 2.3% |
| Interquartile 75% (IQ3) | 4.7% | 15.9% |
| Interquartile Range (IQR) | 1.1% | 13.6% |
| Standard Deviation (Sample) | 1.0% | 25.8% |
| Standard Deviation (Population) | 1.0% | 25.1% |
Similar Demographics by Unemployment Among Ages 35 to 44 years
Demographics Similar to Asians by Unemployment Among Ages 35 to 44 years
In terms of unemployment among ages 35 to 44 years, the demographic groups most similar to Asians are Immigrants from Moldova (4.4%, a difference of 0.030%), Chilean (4.4%, a difference of 0.050%), Immigrants from Hong Kong (4.4%, a difference of 0.12%), English (4.4%, a difference of 0.15%), and Immigrants from Argentina (4.4%, a difference of 0.16%).
| Demographics | Rating | Rank | Unemployment Among Ages 35 to 44 years |
| British | 98.3 /100 | #47 | Exceptional 4.4% |
| Bhutanese | 98.2 /100 | #48 | Exceptional 4.4% |
| Swiss | 98.2 /100 | #49 | Exceptional 4.4% |
| Immigrants | Turkey | 97.8 /100 | #50 | Exceptional 4.4% |
| Immigrants | Eastern Asia | 97.8 /100 | #51 | Exceptional 4.4% |
| Okinawans | 97.7 /100 | #52 | Exceptional 4.4% |
| Immigrants | Argentina | 97.6 /100 | #53 | Exceptional 4.4% |
| Asians | 97.4 /100 | #54 | Exceptional 4.4% |
| Immigrants | Moldova | 97.3 /100 | #55 | Exceptional 4.4% |
| Chileans | 97.3 /100 | #56 | Exceptional 4.4% |
| Immigrants | Hong Kong | 97.2 /100 | #57 | Exceptional 4.4% |
| English | 97.2 /100 | #58 | Exceptional 4.4% |
| Greeks | 97.1 /100 | #59 | Exceptional 4.4% |
| Taiwanese | 97.1 /100 | #60 | Exceptional 4.4% |
| Croatians | 97.1 /100 | #61 | Exceptional 4.4% |
Demographics Similar to Menominee by Unemployment Among Ages 35 to 44 years
In terms of unemployment among ages 35 to 44 years, the demographic groups most similar to Menominee are Immigrants from Yemen (6.6%, a difference of 0.36%), Alaska Native (6.6%, a difference of 0.43%), Cape Verdean (6.6%, a difference of 0.47%), Shoshone (6.6%, a difference of 1.2%), and Dominican (6.4%, a difference of 1.6%).
| Demographics | Rating | Rank | Unemployment Among Ages 35 to 44 years |
| Immigrants | St. Vincent and the Grenadines | 0.0 /100 | #317 | Tragic 6.2% |
| Colville | 0.0 /100 | #318 | Tragic 6.2% |
| Immigrants | Grenada | 0.0 /100 | #319 | Tragic 6.2% |
| Immigrants | Armenia | 0.0 /100 | #320 | Tragic 6.2% |
| Chippewa | 0.0 /100 | #321 | Tragic 6.2% |
| Immigrants | Dominican Republic | 0.0 /100 | #322 | Tragic 6.4% |
| Dominicans | 0.0 /100 | #323 | Tragic 6.4% |
| Menominee | 0.0 /100 | #324 | Tragic 6.5% |
| Immigrants | Yemen | 0.0 /100 | #325 | Tragic 6.6% |
| Alaska Natives | 0.0 /100 | #326 | Tragic 6.6% |
| Cape Verdeans | 0.0 /100 | #327 | Tragic 6.6% |
| Shoshone | 0.0 /100 | #328 | Tragic 6.6% |
| Paiute | 0.0 /100 | #329 | Tragic 6.9% |
| Immigrants | Cabo Verde | 0.0 /100 | #330 | Tragic 6.9% |
| Pueblo | 0.0 /100 | #331 | Tragic 7.1% |