Albanian vs Immigrants from Malaysia No Vehicles in Household
COMPARE
Albanian
Immigrants from Malaysia
No Vehicles in Household
No Vehicles in Household Comparison
Albanians
Immigrants from Malaysia
15.6%
NO VEHICLES IN HOUSEHOLD
0.0/ 100
METRIC RATING
314th/ 347
METRIC RANK
13.6%
NO VEHICLES IN HOUSEHOLD
0.0/ 100
METRIC RATING
284th/ 347
METRIC RANK
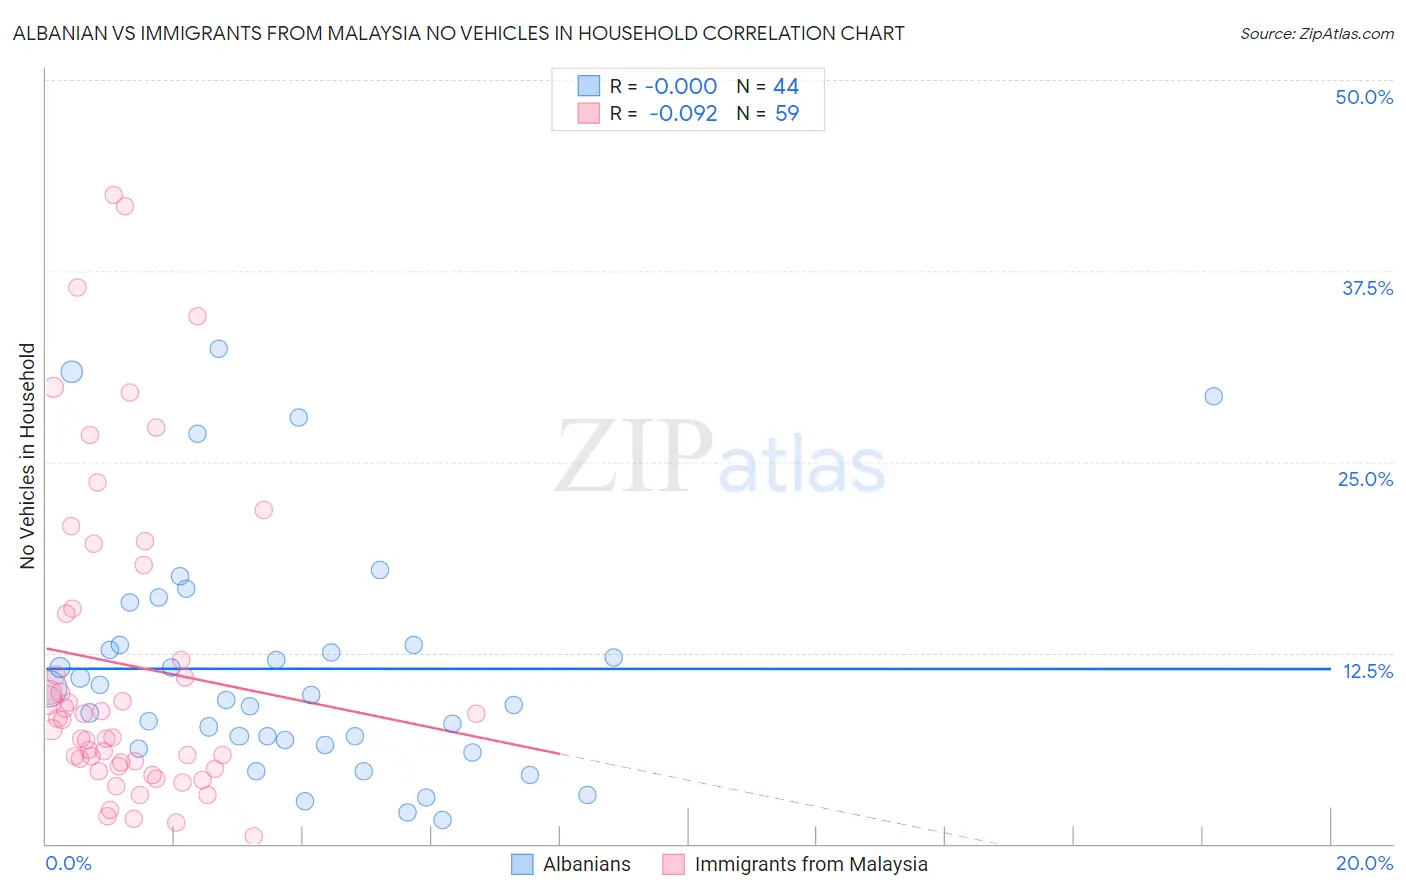
Albanian vs Immigrants from Malaysia No Vehicles in Household Correlation Chart
The statistical analysis conducted on geographies consisting of 193,028,438 people shows no correlation between the proportion of Albanians and percentage of households with no vehicle available in the United States with a correlation coefficient (R) of -0.000 and weighted average of 15.6%. Similarly, the statistical analysis conducted on geographies consisting of 197,816,578 people shows a slight negative correlation between the proportion of Immigrants from Malaysia and percentage of households with no vehicle available in the United States with a correlation coefficient (R) of -0.092 and weighted average of 13.6%, a difference of 15.1%.
No Vehicles in Household Correlation Summary
| Measurement | Albanian | Immigrants from Malaysia |
| Minimum | 1.5% | 0.50% |
| Maximum | 32.4% | 42.5% |
| Range | 30.9% | 42.0% |
| Mean | 11.5% | 11.7% |
| Median | 9.6% | 8.1% |
| Interquartile 25% (IQ1) | 6.7% | 5.1% |
| Interquartile 75% (IQ3) | 13.0% | 15.4% |
| Interquartile Range (IQR) | 6.3% | 10.3% |
| Standard Deviation (Sample) | 7.7% | 10.4% |
| Standard Deviation (Population) | 7.6% | 10.3% |
Similar Demographics by No Vehicles in Household
Demographics Similar to Albanians by No Vehicles in Household
In terms of no vehicles in household, the demographic groups most similar to Albanians are Cypriot (15.7%, a difference of 0.13%), Tohono O'odham (15.6%, a difference of 0.16%), Alaskan Athabascan (15.6%, a difference of 0.31%), Immigrants from Israel (15.6%, a difference of 0.46%), and Cape Verdean (15.6%, a difference of 0.48%).
| Demographics | Rating | Rank | No Vehicles in Household |
| Immigrants | Haiti | 0.0 /100 | #307 | Tragic 15.4% |
| U.S. Virgin Islanders | 0.0 /100 | #308 | Tragic 15.4% |
| Puerto Ricans | 0.0 /100 | #309 | Tragic 15.5% |
| Cape Verdeans | 0.0 /100 | #310 | Tragic 15.6% |
| Immigrants | Israel | 0.0 /100 | #311 | Tragic 15.6% |
| Alaskan Athabascans | 0.0 /100 | #312 | Tragic 15.6% |
| Tohono O'odham | 0.0 /100 | #313 | Tragic 15.6% |
| Albanians | 0.0 /100 | #314 | Tragic 15.6% |
| Cypriots | 0.0 /100 | #315 | Tragic 15.7% |
| Ghanaians | 0.0 /100 | #316 | Tragic 16.4% |
| Immigrants | Ghana | 0.0 /100 | #317 | Tragic 16.6% |
| Immigrants | Belarus | 0.0 /100 | #318 | Tragic 16.7% |
| Alaska Natives | 0.0 /100 | #319 | Tragic 17.4% |
| Soviet Union | 0.0 /100 | #320 | Tragic 17.4% |
| Jamaicans | 0.0 /100 | #321 | Tragic 17.9% |
Demographics Similar to Immigrants from Malaysia by No Vehicles in Household
In terms of no vehicles in household, the demographic groups most similar to Immigrants from Malaysia are Immigrants from Eastern Europe (13.6%, a difference of 0.050%), Immigrants from Kazakhstan (13.6%, a difference of 0.24%), Immigrants from Eastern Asia (13.5%, a difference of 0.28%), Colville (13.7%, a difference of 0.71%), and Immigrants from Ireland (13.7%, a difference of 0.92%).
| Demographics | Rating | Rank | No Vehicles in Household |
| Aleuts | 0.1 /100 | #277 | Tragic 13.0% |
| Immigrants | Croatia | 0.1 /100 | #278 | Tragic 13.0% |
| Mongolians | 0.0 /100 | #279 | Tragic 13.1% |
| Alsatians | 0.0 /100 | #280 | Tragic 13.2% |
| Central American Indians | 0.0 /100 | #281 | Tragic 13.3% |
| Immigrants | Eastern Asia | 0.0 /100 | #282 | Tragic 13.5% |
| Immigrants | Kazakhstan | 0.0 /100 | #283 | Tragic 13.6% |
| Immigrants | Malaysia | 0.0 /100 | #284 | Tragic 13.6% |
| Immigrants | Eastern Europe | 0.0 /100 | #285 | Tragic 13.6% |
| Colville | 0.0 /100 | #286 | Tragic 13.7% |
| Immigrants | Ireland | 0.0 /100 | #287 | Tragic 13.7% |
| Hopi | 0.0 /100 | #288 | Tragic 13.7% |
| Immigrants | Australia | 0.0 /100 | #289 | Tragic 13.8% |
| Indians (Asian) | 0.0 /100 | #290 | Tragic 14.1% |
| Okinawans | 0.0 /100 | #291 | Tragic 14.1% |