Zip Codes with the Highest Percentage of Population Employed in Accommodation & Food Services in Herndon, VA
RELATED REPORTS & OPTIONS
Accommodation & Food Services
Herndon
Compare Zip Codes
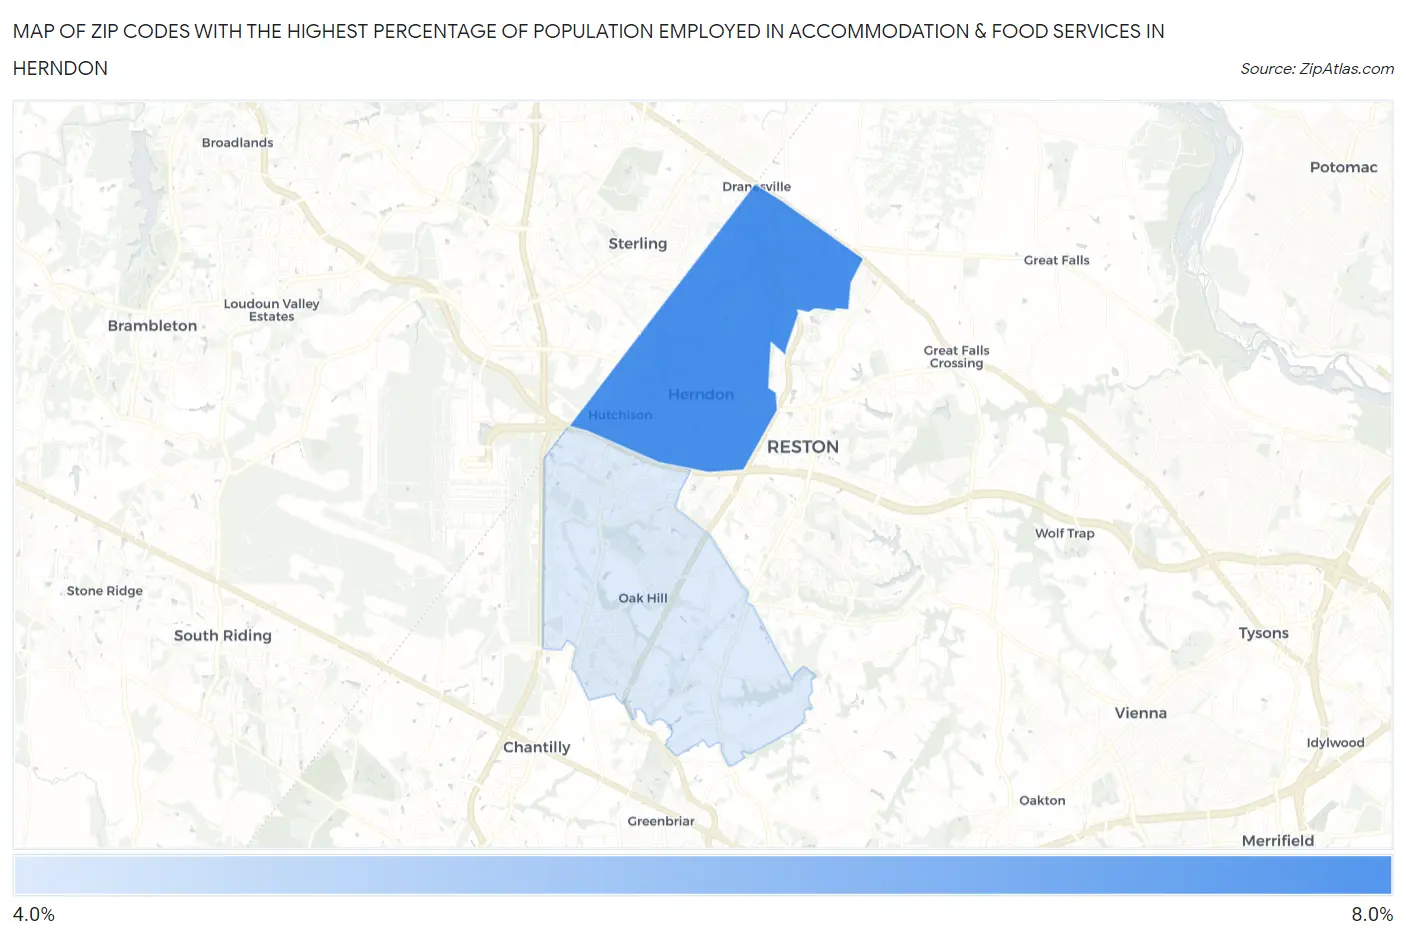
Map of Zip Codes with the Highest Percentage of Population Employed in Accommodation & Food Services in Herndon
4.7%
6.8%
Zip Codes with the Highest Percentage of Population Employed in Accommodation & Food Services in Herndon, VA
| Zip Code | % Employed | vs State | vs National | |
| 1. | 20170 | 6.8% | 6.4%(+0.341)#289 | 6.9%(-0.099)#10,945 |
| 2. | 20171 | 4.7% | 6.4%(-1.74)#463 | 6.9%(-2.18)#17,817 |
1
Common Questions
What are the Top Zip Codes with the Highest Percentage of Population Employed in Accommodation & Food Services in Herndon, VA?
Top Zip Codes with the Highest Percentage of Population Employed in Accommodation & Food Services in Herndon, VA are:
What zip code has the Highest Percentage of Population Employed in Accommodation & Food Services in Herndon, VA?
20170 has the Highest Percentage of Population Employed in Accommodation & Food Services in Herndon, VA with 6.8%.
What is the Percentage of Population Employed in Accommodation & Food Services in Herndon, VA?
Percentage of Population Employed in Accommodation & Food Services in Herndon is 7.5%.
What is the Percentage of Population Employed in Accommodation & Food Services in Virginia?
Percentage of Population Employed in Accommodation & Food Services in Virginia is 6.4%.
What is the Percentage of Population Employed in Accommodation & Food Services in the United States?
Percentage of Population Employed in Accommodation & Food Services in the United States is 6.9%.