Zip Codes with the Highest Percentage of Population Employed in Accommodation & Food Services in Leesburg, VA
RELATED REPORTS & OPTIONS
Accommodation & Food Services
Leesburg
Compare Zip Codes
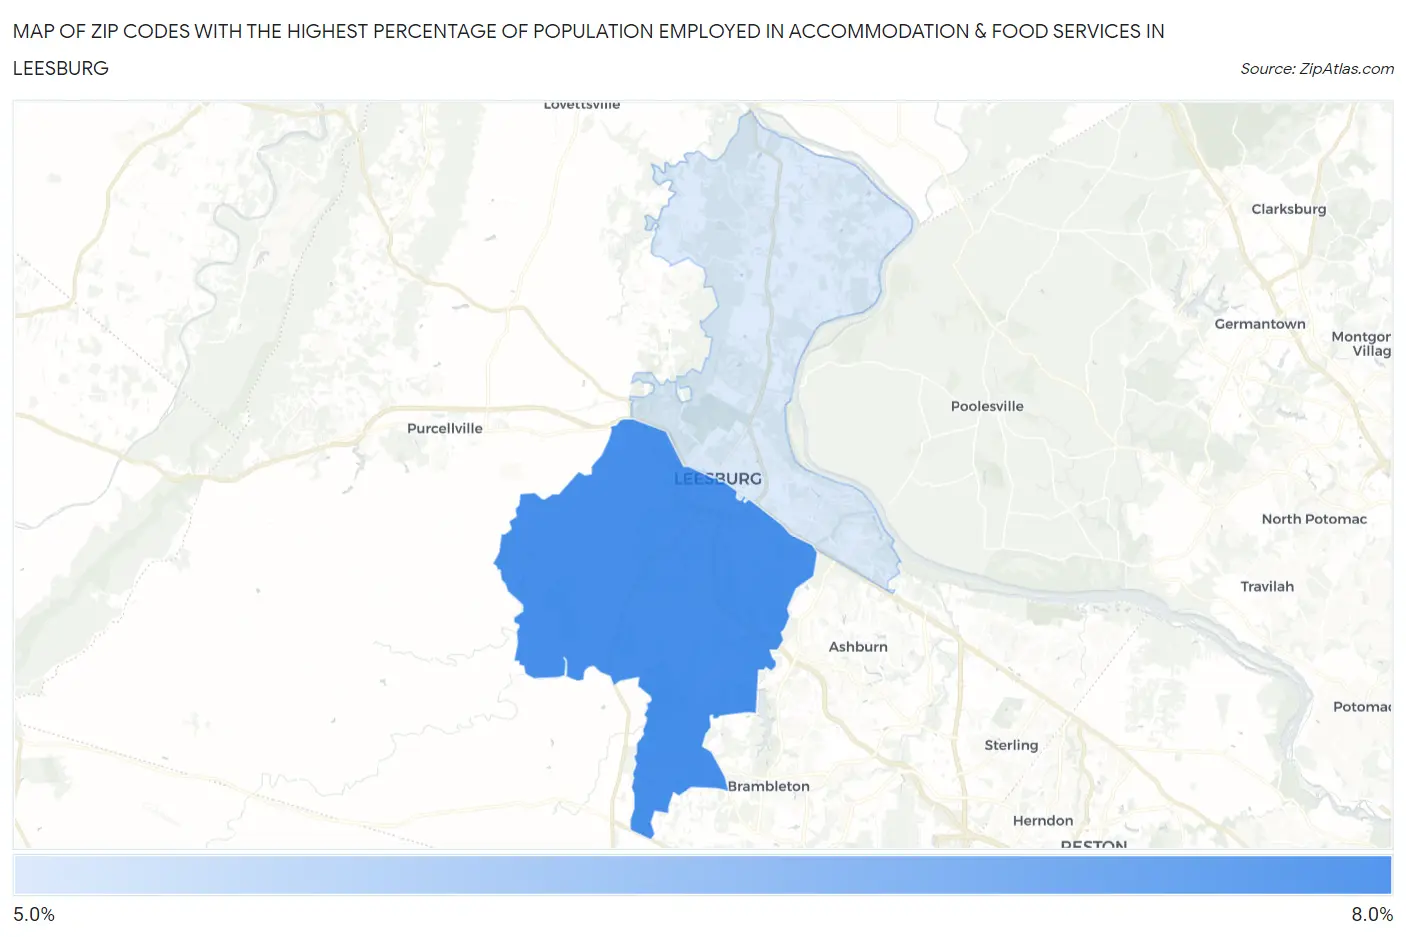
Map of Zip Codes with the Highest Percentage of Population Employed in Accommodation & Food Services in Leesburg
5.2%
6.8%
Zip Codes with the Highest Percentage of Population Employed in Accommodation & Food Services in Leesburg, VA
| Zip Code | % Employed | vs State | vs National | |
| 1. | 20175 | 6.8% | 6.4%(+0.365)#284 | 6.9%(-0.075)#10,871 |
| 2. | 20176 | 5.2% | 6.4%(-1.28)#431 | 6.9%(-1.72)#16,229 |
1
Common Questions
What are the Top Zip Codes with the Highest Percentage of Population Employed in Accommodation & Food Services in Leesburg, VA?
Top Zip Codes with the Highest Percentage of Population Employed in Accommodation & Food Services in Leesburg, VA are:
What zip code has the Highest Percentage of Population Employed in Accommodation & Food Services in Leesburg, VA?
20175 has the Highest Percentage of Population Employed in Accommodation & Food Services in Leesburg, VA with 6.8%.
What is the Percentage of Population Employed in Accommodation & Food Services in Leesburg, VA?
Percentage of Population Employed in Accommodation & Food Services in Leesburg is 7.6%.
What is the Percentage of Population Employed in Accommodation & Food Services in Virginia?
Percentage of Population Employed in Accommodation & Food Services in Virginia is 6.4%.
What is the Percentage of Population Employed in Accommodation & Food Services in the United States?
Percentage of Population Employed in Accommodation & Food Services in the United States is 6.9%.