Zip Codes with the Highest Percentage of Population Employed in Accommodation & Food Services in Manassas, VA
RELATED REPORTS & OPTIONS
Accommodation & Food Services
Manassas
Compare Zip Codes
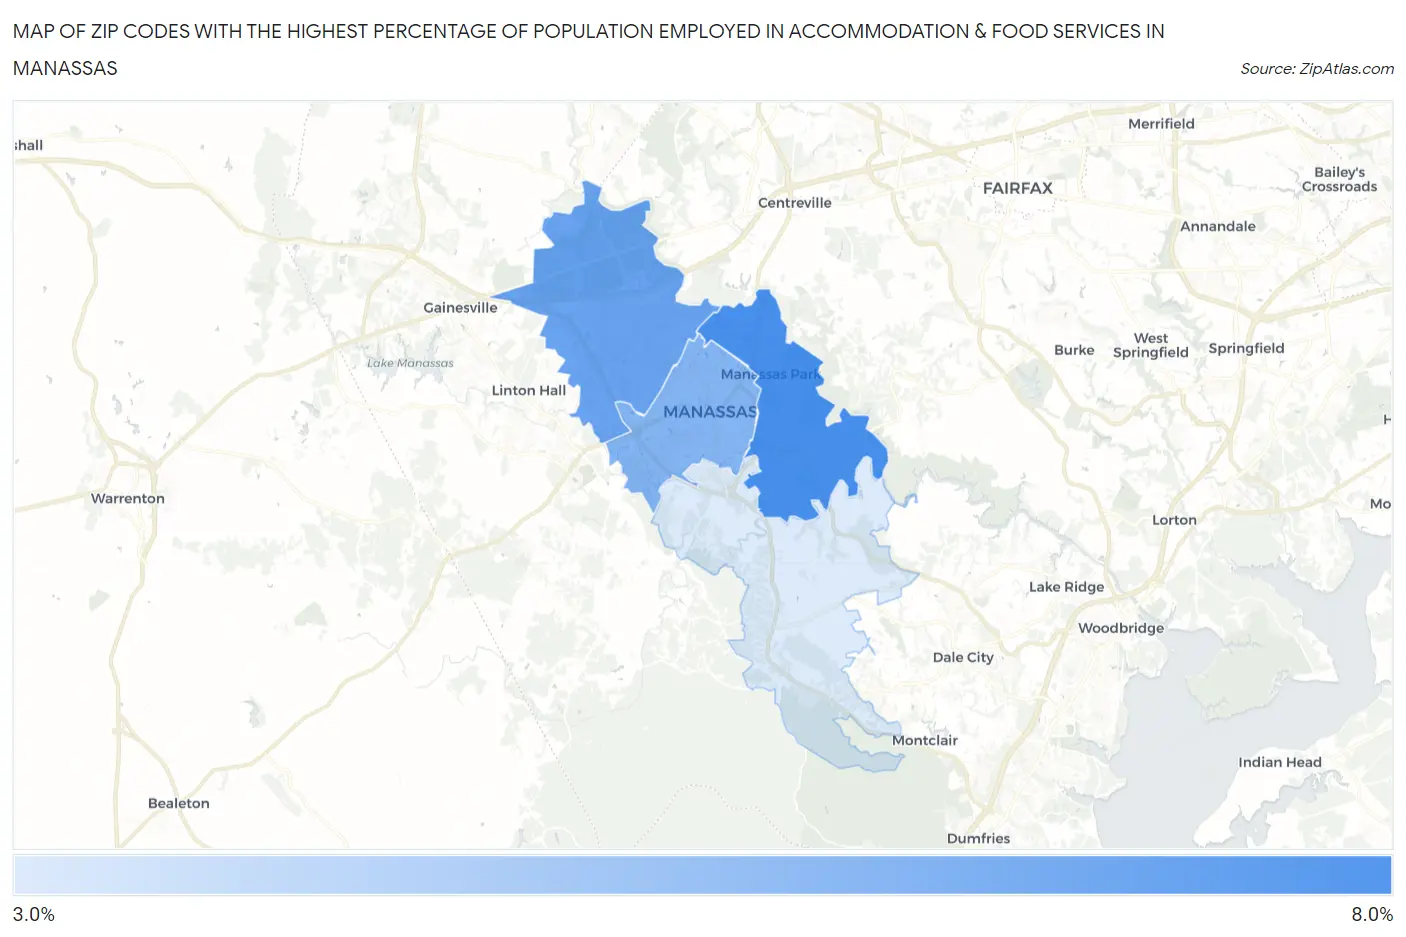
Map of Zip Codes with the Highest Percentage of Population Employed in Accommodation & Food Services in Manassas
3.7%
7.6%
Zip Codes with the Highest Percentage of Population Employed in Accommodation & Food Services in Manassas, VA
| Zip Code | % Employed | vs State | vs National | |
| 1. | 20111 | 7.6% | 6.4%(+1.11)#223 | 6.9%(+0.672)#8,854 |
| 2. | 20109 | 6.7% | 6.4%(+0.241)#297 | 6.9%(-0.199)#11,250 |
| 3. | 20110 | 6.0% | 6.4%(-0.461)#357 | 6.9%(-0.901)#13,506 |
| 4. | 20112 | 3.7% | 6.4%(-2.75)#541 | 6.9%(-3.19)#21,149 |
1
Common Questions
What are the Top 3 Zip Codes with the Highest Percentage of Population Employed in Accommodation & Food Services in Manassas, VA?
Top 3 Zip Codes with the Highest Percentage of Population Employed in Accommodation & Food Services in Manassas, VA are:
What zip code has the Highest Percentage of Population Employed in Accommodation & Food Services in Manassas, VA?
20111 has the Highest Percentage of Population Employed in Accommodation & Food Services in Manassas, VA with 7.6%.
What is the Percentage of Population Employed in Accommodation & Food Services in Manassas, VA?
Percentage of Population Employed in Accommodation & Food Services in Manassas is 6.1%.
What is the Percentage of Population Employed in Accommodation & Food Services in Virginia?
Percentage of Population Employed in Accommodation & Food Services in Virginia is 6.4%.
What is the Percentage of Population Employed in Accommodation & Food Services in the United States?
Percentage of Population Employed in Accommodation & Food Services in the United States is 6.9%.