Seminole vs Czech Unemployment Among Ages 30 to 34 years

COMPARE

Seminole
Race
Ancestry
AfghanAfricanAlaska NativeAlaskan AthabascanAlbanianAleutAlsatianAmericanApacheArabArapahoArgentineanArmenianAssyrian/Chaldean/SyriacAustralianAustrianBahamianBangladeshiBarbadianBasqueBelgianBelizeanBermudanBhutaneseBlackfeetBolivianBrazilianBritishBritish West IndianBulgarianBurmeseCajunCambodianCanadianCape VerdeanCarpatho RusynCelticCentral AmericanCentral American IndianCherokeeCheyenneChickasawChileanChineseChippewaChoctawColombianColvilleComancheCosta RicanCreeCreekCroatianCrowCubanCypriotCzechoslovakianDanishDelawareDominicanDutchDutch West IndianEastern EuropeanEcuadorianEgyptianEnglishEstonianEthiopianEuropeanFijianFilipinoFinnishFrenchFrench American IndianFrench CanadianGermanGerman RussianGhanaianGreekGuamanian/ChamorroGuatemalanGuyaneseHaitianHmongHonduranHopiHoumaHungarianIcelanderIndian (Asian)IndonesianInupiatIranianIraqiIrishIroquoisIsraeliItalianJamaicanJapaneseJordanianKenyanKiowaKoreanLaotianLatvianLebaneseLiberianLithuanianLumbeeLuxembourgerMacedonianMalaysianMalteseMarshalleseMenomineeMexicanMexican American IndianMongolianMoroccanNative HawaiianNavajoNepaleseNew ZealanderNicaraguanNigerianNorthern EuropeanNorwegianOkinawanOsageOttawaPaiutePakistaniPalestinianPanamanianParaguayanPennsylvania GermanPeruvianPimaPolishPortuguesePotawatomiPuebloPuerto RicanPuget Sound SalishRomanianRussianSalvadoranSamoanScandinavianScotch-IrishScottishSeminoleSenegaleseSerbianShoshoneSierra LeoneanSiouxSlavicSlovakSloveneSomaliSouth AfricanSouth AmericanSouth American IndianSoviet UnionSpaniardSpanishSpanish AmericanSpanish American IndianSri LankanSubsaharan AfricanSudaneseSwedishSwissSyrianTaiwaneseThaiTlingit-HaidaTohono O'OdhamTonganTrinidadian and TobagonianTsimshianTurkishU.S. Virgin IslanderUgandanUkrainianUruguayanUteVenezuelanVietnameseWelshWest IndianYakamaYaquiYugoslavianYumanYup'ikZimbabwean
Immigration
NonimmigrantsImmigrantsAfghanistanAfricaAlbaniaArgentinaArmeniaAsiaAustraliaAustriaBahamasBangladeshBarbadosBelarusBelgiumBelizeBoliviaBosnia and HerzegovinaBrazilBulgariaBurma/MyanmarCabo VerdeCambodiaCameroonCanadaCaribbeanCentral AmericaChileChinaColombiaCongoCosta RicaCroatiaCubaCzechoslovakiaDenmarkDominicaDominican RepublicEastern AfricaEastern AsiaEastern EuropeEcuadorEgyptEl SalvadorEnglandEritreaEthiopiaEuropeFijiFranceGermanyGhanaGreeceGrenadaGuatemalaGuyanaHaitiHondurasHong KongHungaryIndiaIndonesiaIranIraqIrelandIsraelItalyJamaicaJapanJordanKazakhstanKenyaKoreaKuwaitLaosLatin AmericaLatviaLebanonLiberiaLithuaniaMalaysiaMexicoMicronesiaMiddle AfricaMoldovaMoroccoNepalNetherlandsNicaraguaNigeriaNorth AmericaNorth MacedoniaNorthern AfricaNorthern EuropeNorwayOceaniaPakistanPanamaPeruPhilippinesPolandPortugalRomaniaRussiaSaudi ArabiaScotlandSenegalSerbiaSierra LeoneSingaporeSomaliaSouth AfricaSouth AmericaSouth Central AsiaSouth Eastern AsiaSouthern EuropeSpainSri LankaSt. Vincent and the GrenadinesSudanSwedenSwitzerlandSyriaTaiwanThailandTrinidad and TobagoTurkeyUgandaUkraineUruguayUzbekistanVenezuelaVietnamWest IndiesWestern AfricaWestern AsiaWestern EuropeYemenZaireZimbabweAzores
Czech
Race
Ancestry
AfghanAfricanAlaska NativeAlaskan AthabascanAlbanianAleutAlsatianAmericanApacheArabArapahoArgentineanArmenianAssyrian/Chaldean/SyriacAustralianAustrianBahamianBangladeshiBarbadianBasqueBelgianBelizeanBermudanBhutaneseBlackfeetBolivianBrazilianBritishBritish West IndianBulgarianBurmeseCajunCambodianCanadianCape VerdeanCarpatho RusynCelticCentral AmericanCentral American IndianCherokeeCheyenneChickasawChileanChineseChippewaChoctawColombianColvilleComancheCosta RicanCreeCreekCroatianCrowCubanCypriotCzechCzechoslovakianDanishDelawareDominicanDutchDutch West IndianEastern EuropeanEcuadorianEgyptianEnglishEstonianEthiopianEuropeanFijianFilipinoFinnishFrenchFrench American IndianFrench CanadianGermanGerman RussianGhanaianGreekGuamanian/ChamorroGuatemalanGuyaneseHaitianHmongHonduranHopiHoumaHungarianIcelanderIndian (Asian)IndonesianInupiatIranianIraqiIrishIroquoisIsraeliItalianJamaicanJapaneseJordanianKenyanKiowaKoreanLaotianLatvianLebaneseLiberianLithuanianLumbeeLuxembourgerMacedonianMalaysianMalteseMarshalleseMenomineeMexicanMexican American IndianMongolianMoroccanNative HawaiianNavajoNepaleseNew ZealanderNicaraguanNigerianNorthern EuropeanNorwegianOkinawanOsageOttawaPaiutePakistaniPalestinianPanamanianParaguayanPennsylvania GermanPeruvianPimaPolishPortuguesePotawatomiPuebloPuerto RicanPuget Sound SalishRomanianRussianSalvadoranSamoanScandinavianScotch-IrishScottishSenegaleseSerbianShoshoneSierra LeoneanSiouxSlavicSlovakSloveneSomaliSouth AfricanSouth AmericanSouth American IndianSoviet UnionSpaniardSpanishSpanish AmericanSpanish American IndianSri LankanSubsaharan AfricanSudaneseSwedishSwissSyrianTaiwaneseThaiTlingit-HaidaTohono O'OdhamTonganTrinidadian and TobagonianTsimshianTurkishU.S. Virgin IslanderUgandanUkrainianUruguayanUteVenezuelanVietnameseWelshWest IndianYakamaYaquiYugoslavianYumanYup'ikZimbabwean
Immigration
NonimmigrantsImmigrantsAfghanistanAfricaAlbaniaArgentinaArmeniaAsiaAustraliaAustriaBahamasBangladeshBarbadosBelarusBelgiumBelizeBoliviaBosnia and HerzegovinaBrazilBulgariaBurma/MyanmarCabo VerdeCambodiaCameroonCanadaCaribbeanCentral AmericaChileChinaColombiaCongoCosta RicaCroatiaCubaCzechoslovakiaDenmarkDominicaDominican RepublicEastern AfricaEastern AsiaEastern EuropeEcuadorEgyptEl SalvadorEnglandEritreaEthiopiaEuropeFijiFranceGermanyGhanaGreeceGrenadaGuatemalaGuyanaHaitiHondurasHong KongHungaryIndiaIndonesiaIranIraqIrelandIsraelItalyJamaicaJapanJordanKazakhstanKenyaKoreaKuwaitLaosLatin AmericaLatviaLebanonLiberiaLithuaniaMalaysiaMexicoMicronesiaMiddle AfricaMoldovaMoroccoNepalNetherlandsNicaraguaNigeriaNorth AmericaNorth MacedoniaNorthern AfricaNorthern EuropeNorwayOceaniaPakistanPanamaPeruPhilippinesPolandPortugalRomaniaRussiaSaudi ArabiaScotlandSenegalSerbiaSierra LeoneSingaporeSomaliaSouth AfricaSouth AmericaSouth Central AsiaSouth Eastern AsiaSouthern EuropeSpainSri LankaSt. Vincent and the GrenadinesSudanSwedenSwitzerlandSyriaTaiwanThailandTrinidad and TobagoTurkeyUgandaUkraineUruguayUzbekistanVenezuelaVietnamWest IndiesWestern AfricaWestern AsiaWestern EuropeYemenZaireZimbabweAzores
Unemployment Among Ages 30 to 34 years
Income
Poverty
Unemployment
Labor Participation
Family Structure
Vehicle Availability
Education Level
Disability

Unemployment Among Ages 30 to 34 years Comparison

Seminole

Czechs

Tragic
Exceptional
6.2%
UNEMPLOYMENT AMONG AGES 30 TO 34 YEARS
0.0/ 100
METRIC RATING
266th/ 347
METRIC RANK
5.0%
UNEMPLOYMENT AMONG AGES 30 TO 34 YEARS
99.2/ 100
METRIC RATING
36th/ 347
METRIC RANK

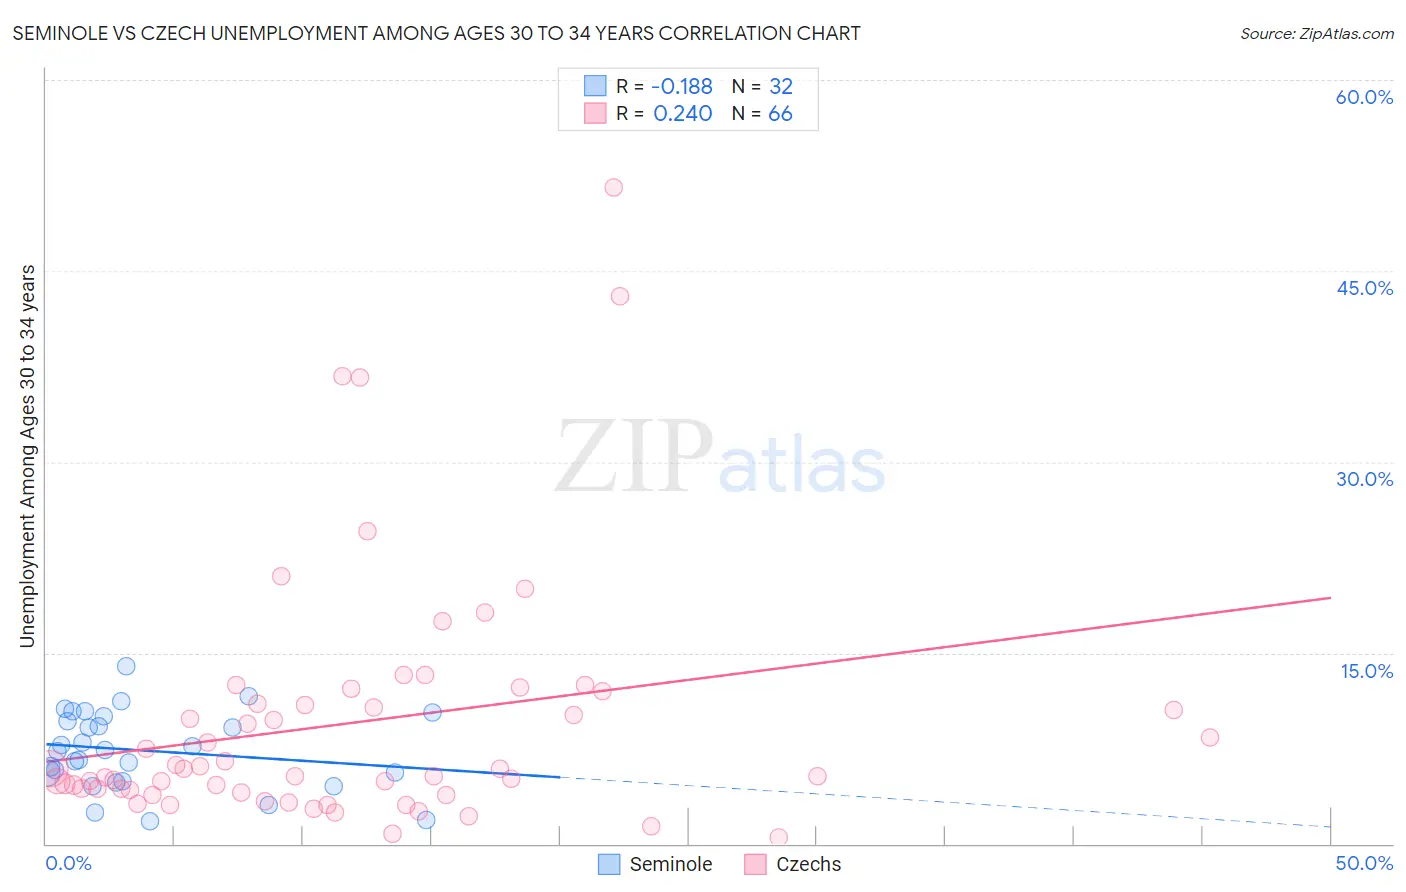
Seminole vs Czech Unemployment Among Ages 30 to 34 years Correlation Chart

The statistical analysis conducted on geographies consisting of 115,777,899 people shows a poor negative correlation between the proportion of Seminole and unemployment rate among population between the ages 30 and 34 in the United States with a correlation coefficient (R) of -0.188 and weighted average of 6.2%. Similarly, the statistical analysis conducted on geographies consisting of 438,540,719 people shows a weak positive correlation between the proportion of Czechs and unemployment rate among population between the ages 30 and 34 in the United States with a correlation coefficient (R) of 0.240 and weighted average of 5.0%, a difference of 24.0%.
Seminole vs Czech Unemployment Among Ages 30 to 34 years

Unemployment Among Ages 30 to 34 years Correlation Summary

MeasurementSeminoleCzech
Minimum1.8%0.50%
Maximum13.9%51.6%
Range12.1%51.1%
Mean7.3%9.5%
Median7.3%5.6%
Interquartile 25% (IQ1)5.2%4.2%
Interquartile 75% (IQ3)9.8%11.0%
Interquartile Range (IQR)4.6%6.7%
Standard Deviation (Sample)3.0%9.8%
Standard Deviation (Population)3.0%9.7%

Similar Demographics by Unemployment Among Ages 30 to 34 years

Demographics Similar to Seminole by Unemployment Among Ages 30 to 34 years

In terms of unemployment among ages 30 to 34 years, the demographic groups most similar to Seminole are American (6.2%, a difference of 0.090%), Chickasaw (6.2%, a difference of 0.20%), Immigrants from Mexico (6.2%, a difference of 0.20%), Spanish American (6.2%, a difference of 0.25%), and Immigrants from Haiti (6.2%, a difference of 0.35%).
DemographicsRating | RankUnemployment Among Ages 30 to 34 years
Haitians
0.1
/100
|
#259
Tragic
6.1%
Immigrants | Latin America
0.1
/100
|
#260
Tragic
6.1%
Immigrants | Western Africa
0.1
/100
|
#261
Tragic
6.2%
Immigrants | Central America
0.1
/100
|
#262
Tragic
6.2%
Spanish Americans
0.0
/100
|
#263
Tragic
6.2%
Chickasaw
0.0
/100
|
#264
Tragic
6.2%
Americans
0.0
/100
|
#265
Tragic
6.2%
Seminole
0.0
/100
|
#266
Tragic
6.2%
Immigrants | Mexico
0.0
/100
|
#267
Tragic
6.2%
Immigrants | Haiti
0.0
/100
|
#268
Tragic
6.2%
French American Indians
0.0
/100
|
#269
Tragic
6.3%
Immigrants | Senegal
0.0
/100
|
#270
Tragic
6.3%
Comanche
0.0
/100
|
#271
Tragic
6.3%
Blackfeet
0.0
/100
|
#272
Tragic
6.3%
Ottawa
0.0
/100
|
#273
Tragic
6.3%

Demographics Similar to Czechs by Unemployment Among Ages 30 to 34 years

In terms of unemployment among ages 30 to 34 years, the demographic groups most similar to Czechs are Immigrants from Ethiopia (5.0%, a difference of 0.040%), Immigrants from Turkey (5.0%, a difference of 0.25%), Sri Lankan (5.0%, a difference of 0.25%), Latvian (5.0%, a difference of 0.28%), and Immigrants from Saudi Arabia (5.0%, a difference of 0.32%).
DemographicsRating | RankUnemployment Among Ages 30 to 34 years
German Russians
99.4
/100
|
#29
Exceptional
5.0%
Norwegians
99.4
/100
|
#30
Exceptional
5.0%
Somalis
99.3
/100
|
#31
Exceptional
5.0%
Immigrants | Zaire
99.3
/100
|
#32
Exceptional
5.0%
Immigrants | Saudi Arabia
99.3
/100
|
#33
Exceptional
5.0%
Latvians
99.3
/100
|
#34
Exceptional
5.0%
Immigrants | Ethiopia
99.2
/100
|
#35
Exceptional
5.0%
Czechs
99.2
/100
|
#36
Exceptional
5.0%
Immigrants | Turkey
99.0
/100
|
#37
Exceptional
5.0%
Sri Lankans
99.0
/100
|
#38
Exceptional
5.0%
Fijians
99.0
/100
|
#39
Exceptional
5.0%
Immigrants | Vietnam
98.9
/100
|
#40
Exceptional
5.0%
Immigrants | Eastern Africa
98.9
/100
|
#41
Exceptional
5.0%
Immigrants | Hong Kong
98.8
/100
|
#42
Exceptional
5.0%
Soviet Union
98.8
/100
|
#43
Exceptional
5.0%